 |
|---|
| Download the PDF version |
A background working paper
Prepared for the Canadian Home Builders’ Association and the Canadian Housing and Renewal Association with support from Genworth Canada
By Steve Pomeroy (Focus Consulting Inc.) and Greg Lampert
December 2017
Table of contents
EXECUTIVE SUMMARY
- Some notable tenure patterns
- Stubborn persisting level of core housing need among renters in particular
- Insights into price rises and ownership affordability
- Increasing down payment burden on first-time buyers
- Policy changes impacting the housing tenure system
- Consolidation and insights
- Critical need to expand data collection and analysis
- Conclusion
1 | INTRODUCTION
2 | OVERALL TENURE PATTERNS TO 2011
- What caused such a large and fast rise?
- Demographic influences
- Lack of data to clearly determine impacts on first time buyers
- And what about the rental sector?
- New housing production
- Low rental production has not (yet) caused serious issues in the rental sector
- New production is not necessarily mono-tenure
- Investor Condominiums have become a significant source of rental supply
- Large secondary market
- Small and declining non-market social sector
- Changes in the existing rental stock
- Ongoing transactions in rental investment properties
3 | TRENDS IN CORE HOUSING NEED
- Renter core need influenced by broader economic conditions
- Dynamics of core need
4 | RECENT PRICE AND RENT TRENDS
- Price-to-income ratio a poor metric
- Exploring post 2014 price divergence
- Short-term effects of migration
- Home speculation
- New home price data show more moderate gains
- Supply and inventory effects
- Impact of move-up buyers
- Increasing down payment burden on first time buyer
- Rent Trends
- Expanding influence of investor suppliers
5 | POLICY CHANGES IMPACTING THE HOUSING SYSTEM
- 5.1 POLICY AND EXPENDITURE TRENDS IN AFFORDABLE HOUSING
- The National Housing Strategy
- 5.2 REVIEW AND SUMMARY OF KEY LENDING AND MACRO-PRUDENTIAL POLICY CHANGES
- Changes to Insured Mortgage Lending Regulations
- Provincial policy change
6 | FOCUSING ON FIRST TIME BUYERS
7 | CONSOLIDATION AND INSIGHTS
- Changes within the existing stock are very significant to the operation of the housing system
- Constrained access to ownership
- Encouraging both traditional and non-traditional rental supply
- Erosion of lower rent stock
- Creating policy to support a healthy rental sector
- Role of non-profit/non-market sector
- Critical need to expand data collection and analysis
- Conclusion
Acknowledgement and disclaimer
This report was prepared for the Canadian Home Builder’s Association (CHBA) and the Canadian Housing and Renewal Association (CHRA) with financial support from Genworth Canada. The analysis and conclusions are solely those of the authors and do not necessarily represent the views and opinions of either association or funders of the research.
NOTE THIS REPORT UPDATES AND REPLACES AN EARLIER VERSION, DATED OCTIOBER 2017. THE UPDATE INCORPORATED NEW DATA RELEASED FROM THE 2016 CENSUS
EXECUTIVE SUMMARY
Canada’s housing tenure system is comprised of three key elements:
- Ownership sector;
- Private market rental sector; and
- Non-market social sector (including co-op and non-profit) in which rents are administratively set below market rates.
The overarching objective of a Canada’s national housing strategy (NHS) is (or should be) to sustain a healthy well-balanced housing system: a system that offers choice across tenures as well as a sufficient supply to maintain choice and relative affordability.
In addition to developing and implementing new initiatives to respond to an array of housing challenges, a critical element of the NHS should be to collect data to pro-actively monitor how well the system is functioning, to establish a process to identify gaps and any dysfunctionality and to implement remedial actions. The release of the NHS in November 2017 suggests that there will be a focus on collecting data and undertaking ongoing analysis. While most of the initiatives and expenditure plans in the NHS are directed primarily to the affordable part of the system, it is expected that CMHC and Statistics Canada, will monitor the impacts and effects of government policy and actions on the health of the housing system at large.
The recent trends and concerns about rising prices, impacts on the broader economy and levels of household debt, as well as the subsequent actions of the Department of Finance and the Office of the Superintendent of Financial Institutions (OSFI) to address these risks, serve to underline this requirement.
This brief establishes that what happens in the larger system and in the existing stock can often be more significant than the effects of new housing construction. It seeks to develop a better understanding about the dynamics of housing stock change. This includes examining the relative volume of tenure shifts from renting to owning (and vice-versa) and implicit “rental supply” resulting from the movement of first-time homebuyers (FTBs) from rental into ownership over the period since the mid-1990’s.
The brief also provides estimates of the supply from other sources (e.g. new purpose-built rental construction, condominium rentals, and tenure shifts in the existing stock) as well as losses through demolitions etc. It examines how the dynamics in the private rental and ownership sectors have knock on effects on the rental as well as the social-affordable part of the system. And it highlights the critical challenge associated with the ongoing erosion of the more affordable parts of the system (both in private rental stock and in the social housing part, where expiring federal subsidies are terminating).
Traditionally in Canada, “purpose-built” housing supply fed the three segments of the housing system. However, within the existing stock there is a dynamic of ongoing change wherein properties ebb and flow between owner and renter occupation (and now between non-market and market rental).
Purpose-built rental starts have for decades been very low, on average below 10% of all starts, while renters have consistently comprised more than 30% of households. Social and affordable starts have been a minimal component since 1994, when federal funding for new development ended, and funding under the post 2002 Investment in Affordable Housing (IAH) program has been very modest. IAH has supported fewer than 5,000 new homes per year although recent budget announcements and the announcement of the NHS will raise this level, with a goal of reducing severe core housing need and eliminating chronic homelessness.
The conceptual flow chart below summarizes some of the key dynamics of the housing system.
- In a total stock of over 14 million homes, each year new construction adds roughly 200,000 homes, representing an increment of only 1.5%.
- The majority of new homes are intended for the ownership part of the market, although up to 25% of new ownership dwellings (up to 40,000) have in recent years been purchased by investors (and subsequently rented out to tenants), rather than by owner-occupants.
- The rest are rental starts, which until the last three years have comprised only 10% of new construction but more recently have edged up closer to 35,000 units (over 15% of all starts).
- The single largest source of rental “supply” has been the units vacated by FTBs moving from the rental sector into ownership. While data is elusive, estimates suggest that FTBs comprise on average roughly 250,000 households annually – over five times the number of units created from new purpose-built rental construction.
It is the dwellings vacated by the FTBs that have by far the most significant and substantial effect in meeting and managing rental demand, moderating vacancy rates and, by sustaining vacancies, helping to manage affordability issues.
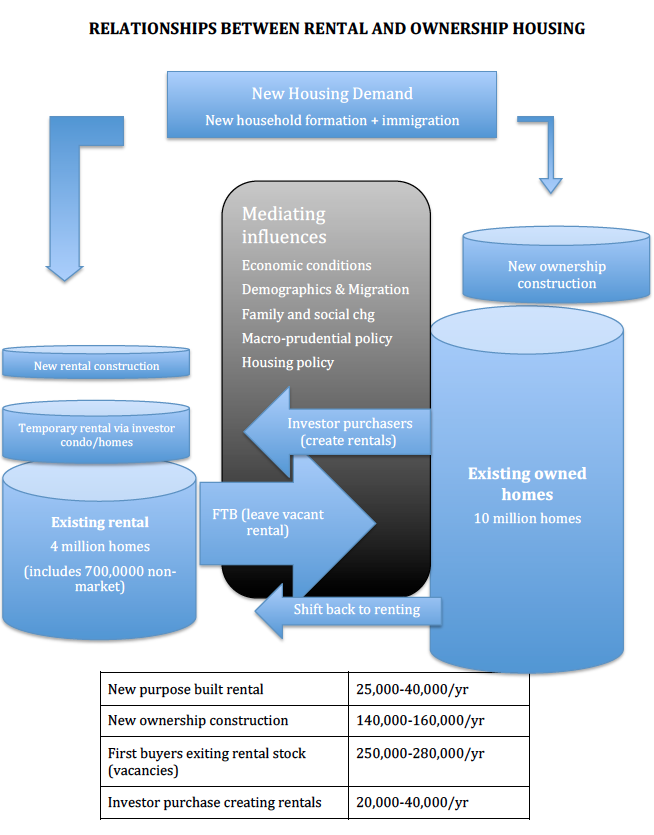
The degree to which ownership properties are accessible to both FTBs and to small-scale investors can have a significant influence on available rental “supply” as well as on the affordability of both owner-occupied dwellings and rental units.
Similarly, transactions of existing multi-unit properties can result in upgrading and rent increases, with movement of relatively affordable units into higher rent ranges.
In part, these dynamics are market driven but they are also influenced by policy choices. Policies to facilitate access to ownership can (and have) helped reduce residual demand in the rental sector and offset low rental starts which, in turn, can moderate otherwise tighter rental markets and upward pressure on rents (this occurred between 1996 and 2006).
Conversely, macro-prudential policies that seek to manage levels of household debt or to manage lending risk, can constrain access to ownership and (an unintended consequence) result in residual and growing demand in an undersupplied rental sector. When pressure builds in the rental sector, rents rise, with follow-on impacts on affordability. In the extreme this may potentially contribute to homelessness for those unable to afford rent increases, or unable to find lower rent options.
In examining home price trends and how these themselves constrain access, it is also notable that data on price changes in the GTA reveal prices in the insured space have remained relatively flat while average prices grew in the double digits in 2016 – thus, FTBs (insured buyers) were not the ones driving home price appreciation, it was driven more by secondary move-up buyers and investors.
For these reasons, it is critically important that policies with impacts across the housing system are carefully reviewed, prior to implementation, and monitored afterwards to identify and mitigate any unintended consequences.
Some notable tenure patterns
Canada experienced an unprecedented rise in its overall ownership rate between 1996 and 2006, largely driven by a strongly recovering economy, the release of pent up demand from the prior decade and a steady decline in mortgage rates. This substantial shift from renting to owning played an important role in moderating the effects of the low level of rental starts. During that decade, renters shifting to ownership was equivalent to building 88,000 new rental units each year.1
Since 2006 the ownership rate initially stabilized at around 69% (2011), but subsequently fell to 68.7%, the first decline in 50 years. Going forward, the pressure release valve for the rental market that this shift represented between 1996-2006 is no longer available. It appears that constrained access to ownership, due to a combination of high prices and macro-prudential policies have contributed to reversing the process and are now acting to increase demand and pressure in the rental part of the system.
Increased residual rental demand will then have a knock on effect on the low rent part of the system, which would directly impact low-income renters who occupy that stock and exacerbate issues of renter affordability.
Stubborn persisting level of core housing need among renters in particular
Despite the various other changes in the housing system, and the broader economy, the level of core housing need has remained relatively stable, until 2011, and has increased, in absolute terms since 2011. In part, this inability to lower core need reflects the minimal level of investment in various affordable housing programs over the past two decades. When the levels of core need did marginally improve (between 1996-2001), this appears to have been a result of growing employment and incomes, rather than a result of housing programs.
While the absolute level of core need, especially among renters remained relatively consistent at least until 2011, it is important to highlight that there is a dynamic churn among these households. Generally two-thirds of renters in core need are in that situation for less than 3 years. This highlights the need to manage affordable housing policy in collaboration with income assistance and poverty reduction strategies.
Insights into price rises and ownership affordability
Recent media attention has highlighted dramatic price increases and concern about ownership affordability (again for FTBs) in Vancouver and Toronto. The analysis here found that the broader national trend, in which prices rose across all centres, was well supported by fundamentals, especially employment and income growth augmented by steadily declining and historically low mortgage rates. The key factors evident in Vancouver and Toronto, in addition to some effects of foreign buyers, was the pattern of migration to those two cities, especially after the energy sector downturn in late 2014 and the trend of reduced existing homes listed for sale.
More broadly, across all cities, the role of existing owners as move-up buyers is also important. These “subsequent buyers” have a high capacity to absorb higher prices, and indeed to continue to drive prices up further, because they have benefited from substantial rates of appreciation and, in the low interest rate environment over the past decade, their mortgage payments have more rapidly reduced their principal balance, adding to their net equity. Buying a home at $1 million is not that difficult if you have just sold a house for $800,000 (which you may have purchased ten or fifteen years earlier for less than half that amount).
Increasing down payment burden on first-time buyers
Higher prices require higher down payments, especially alongside policy changes that have eliminated loans at 100% of value and in higher cost markets where the maximum loan-to-value for mortgages has been reduced from 95% to 90% on properties exceeding $500,000. For FTBs, and especially those without family financial help, the higher down payment amount may be becoming a serious constraint to accessing ownership. This issue is further exacerbated in those markets still experiencing high rates of price appreciation (again mainly Vancouver and Toronto), as the prices move-up faster than their ability to accumulate a down payment.
Policy changes impacting the housing tenure system
The various trends and outcomes described in the paper have largely reflected the influence of market conditions, including both demand and supply influences. However, there has also been some significant impact from various government policy and expenditure decisions.
In the private rented sector, there have been very few intentional policy changes since 2000 (with exception of some regulatory changes in some provinces to strengthen consumer protection, notably in Ontario, and a rental investment tax credit program in Manitoba).
The most significant policy changes have been those directed to the homeownership parts of the housing system (lending rules and stress tests) and more recently the announcement of a National Housing Strategy, which will commence implementation in 2018.
Prior to the recent NHS, reduced government expenditures have been most notable in the social-affordable housing sector. In particular, the expiry of federal operating agreements and related subsidies has created both challenges and opportunities (for projects with a lower proportion of RGI, which have positive cash flow after expiry). In many cases, where the projects are not viable, this is adding fiscal pressure to provinces and territories, many of which have limited capacity to pick up the slack from expiring federal funding.
Recent 2016 and 2017 federal budgets, together with the prospects from the new NHS are anticipated to create increased funding and supportive policy reforms. The federal government has also committed to reinvest in the existing PT owned stock, on a cost matched basis.
Consolidation and insights
The review of data and trends in this paper raises a number of issues and highlights the critical overlap and interdependencies of each segment of the housing system. In particular, it highlights the critical role of FTBs transitioning from the rental to the ownership market in sustaining a healthy housing market, as well as the need for policies to facilitate their participation.
Younger households are the primary source of new rental demand. Many aspire to ownership but may be constrained by a combination of high prices, large deposit requirements (related to high prices) and cautious macro-prudential policies that tend to target FTBs, even though these households may not be the most significant cause of rising overall household debt.
The key role of the FTB in purchasing the generally more modest homes vacated by move-up buyers, and thus fuelling the increase in demand required to support the market for new ownership housing, is fairly well understood.
Less well understood is the concomitant role of the FTB in creating a “supply” of vacancies in the existing rental housing stock by leaving the rental sector as they move into homeownership. Any slowdown in the natural process of young households leaving rental housing to buy their first home will have a dramatic negative effect on the rental market. At roughly 250,000 units a year, this “supply” of rental housing from departing FTBs dwarfs the additions to the rental stock provided through new rental construction and provides the vacant rental units necessary to accommodate newly-forming households.
In addition to the significant issue of access to ownership for FTBs, and the ramifications of constrained access on the rest of the housing system, the paper highlights a number of other issues and challenges:
- Changes (tenure shifts) within the existing stock are very significant to the overall functioning of the housing system (additions to the stock).
- While there is concern that current policies may constrain access to ownership, this does not mean that housing policy should focus only on enabling this aspiration. In the context of constrained ownership access it has become critically important to establish a policy framework that grows and strengthens the purpose built rented sector to provide a full range of housing opportunities. Options and incentives to help encourage non-traditional “rental supply” are necessary to balance out the potential impacts of constrained access to ownership.
- Role of non-profit/non-market sector – the social-non-market housing stock is a small but important part of Canada’s housing system. It provides a valuable resource to low and moderate-income households as well as those with special needs such as the homeless and Indigenous people. Public and non-profit ownership of housing in the non-market sector helps to preserve affordable rent options for those who need it. Options to enable and encourage non-profit providers to purchase existing (private) rental assets should be explored as a way to help preserve existing moderate-rent stock and augment the “supply” of affordable housing. This can complement other options such as redevelopment and leverage of existing social housing assets.
- An alternative, which should be considered, is to separate supply programs from affordability – i.e. new projects would be developed at market (or near-market) rents. Affordability for some percentage of the units can then be separately managed by providing housing allowances to lower income tenants.
- There is potentially also a role for the non-profit sector to participate in building modest market rental, with rents in the range of 100-130% of the average market rent (AMR). Non-profits could develop such projects in this “intermediate market” as a way to add supply (without need for subsidy) and concurrently strengthen the viability of their organizations by reducing reliance on low-rent social housing.
Critical need to expand data collection and analysis
Across these issues there is a critically important common theme: there are insufficient and inadequate data available to fully monitor and appreciate the ongoing changes in Canada’s dynamic housing system. Effort and investment is required to strengthen data collection systems and coverage to enable appropriate monitoring and management of the housing system (and the NHS has identified investment in this area). This includes better data gathering and analysis across all elements including quantification of the volume and trends of FTBs, the number and impact of investor purchasers creating rental “supply”, enumeration of additions under various social-affordable programs as well as any losses due to expiring federal agreements and related subsidy.
It is noted that Budget 2017 has signaled a commitment to evidence-based policy and decision-making and has made substantial financial commitments to this end. This includes $241 million over 11 years to enable CMHC to improve data collection and analytics, expand housing research with partners, and demonstrate and test new design solutions to affordable housing challenges. It also provided $39.9 million to Statistics Canada to develop and implement a new Housing Statistics Framework.
With this level of financial resourcing it is expected that a substantial progress can be made in strengthening data collection systems and coverage to enable appropriate monitoring and management of the housing system.
Conclusion
The analysis in this paper has clearly revealed that anything done in one segment of the system (e.g. tightening insured mortgage lending rules) creates consequences in other parts of the market, in particular rental availability and affordability.
In addition to developing and implementing new initiatives to respond to an array of housing challenges, a critical element of the NHS should be to collect data to help fully understand the wider impacts of specific policy changes and to pro-actively monitor how well the system is functioning, This should include establishing a process to identify gaps and any dysfunctionality and to implement remedial actions.
1 | Introduction
Canada’s housing system is comprised of three key elements:
- Ownership sector;
- Private market rental sector; and
- Non-market social sector (including co-op and non-profit) in which rents are administratively set below market rates.
The overarching objective of a national housing strategy is (or should be) to sustain a healthy well-balanced housing system: a system that offers choice across tenures as well as a sufficient supply to maintain choice and relative affordability.
This paper seeks to develop a better understanding about the dynamics of housing stock change. It examines the relative volume of tenure movement from renting to owning and the implicit “rental supply” resulting from the movement of first-time homebuyers (FTBs) from rental into ownership over the period since the mid-1990’s – along with estimates of the supply from other sources (e.g. new purpose-built rental construction, condominium rentals, and tenure shifts in the existing stock) as well as losses through demolitions etc. Estimates are Canada-wide, but also examine some illustrative case examples using selective local markets.
It also examines how the dynamics in the private rental and ownership part of the system have knock on effects on the rental as well as the social-affordable part of the system.
The paper is organized in five sections. Section 2 examines trends in and influences on tenure patterns while sections 3 and 4 examine recent price and rent trends and the factors that have underpinned these trends as well as trends in core housing need. Section 5 briefly reviews key policy changes, both in the affordable housing part of the system and in relation to managing risks associated with rising levels of mortgage debt and concerns about possible broader economic impacts. Section 6 highlights some key issues and challenges with respect to first time buyers and finally section 7 consolidates the overall findings and highlights critical policy issues that should be captured in the development of a national housing strategy.
2 | Overall tenure patterns to 2011
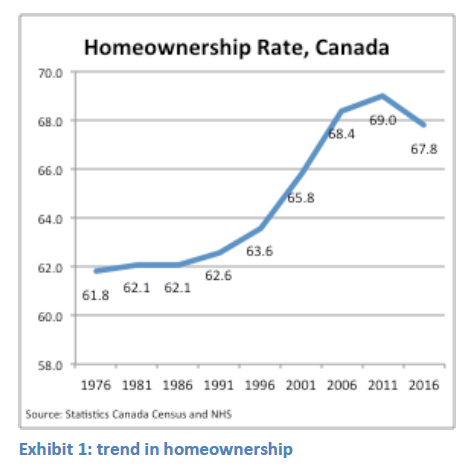 The key trend in tenure patterns over the past two decades was the substantial rise in the homeownership rate across the end of the millennium, and the more recent reversal and decline between 2011-16.
- Another notable factor is the equally dramatic rise in home prices in recent years, especially in Vancouver and Toronto (discussed later).
Previously the ownership rate peaked in 1961 at 66%, before declining to 60% in 1970. After being fairly stable from the mid 1970’s at around 62-63%, the rate of homeownership increased dramatically after 1996, rising five percentage points from 63.6% to 68.4% over the decade from 1996 to 2006. In 2011, it increased modestly to 69%.
This long-term upward trend was however reversed between 2011-16. This is the first time in 50 years that the ownership rate has declined, and is perhaps an early signal that the combination of prices and lending policies may be constraining access to this tenure. While homeownership rates vary somewhat across the country, this pattern of a significant upsurge through 2011 is similar across most Canadian cities.
What caused such a large and fast rise?
The primary factors underpinning this large shift were economic, mainly related to weak versus strong capacity to buy over each decade. In the period from the late 1980’s to the mid 1990’s, weak economic growth and a slow recovery from the recession of the early 1990’s meant slow employment growth and only modest income gains. Coupled with still relatively high mortgage rates, this contributed to a build-up of pent up demand, waiting for the capacity to buy to become more favourable. By the late 1990’s, however, an economic recovery was well underway, with expanding employment and incomes. With the exception of the 2008-09 recession, employment has continued to expand at close to 1.5 percent annually, although employment growth has slowed a little since 2014.
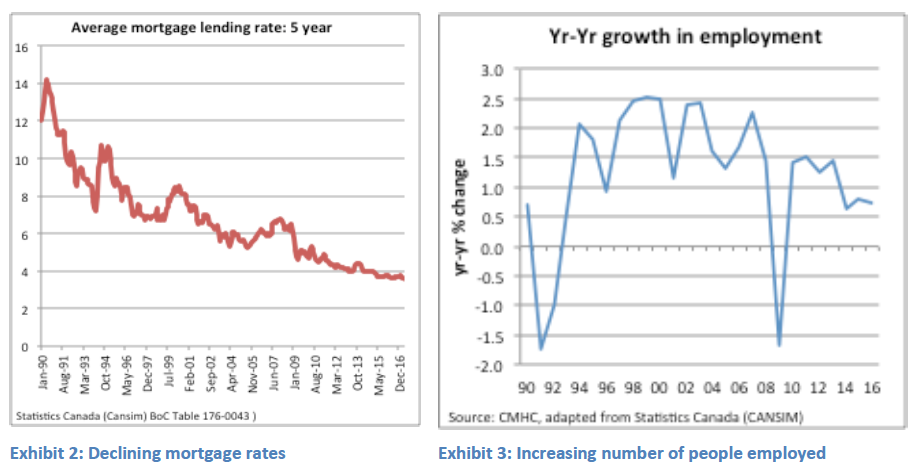
Access to homeownership was abetted by a steady decline in mortgage rates, which combined with solid income gains, helped to release the pent up demand from the prior decade.
Demographic influences
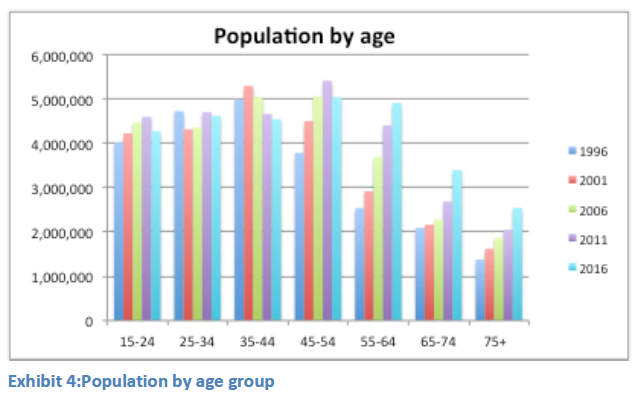 The changing age structure of the population and households had some impact on the homeownership rate, but likely less than the economic influences. Both the 15-24 and 35-44 age cohorts grew during the 1996-2006 decade of rapidly rising homeownership rates, however the main FTB group (25-34) initially declined in absolute size (1996-2001), but expanded after 2006.
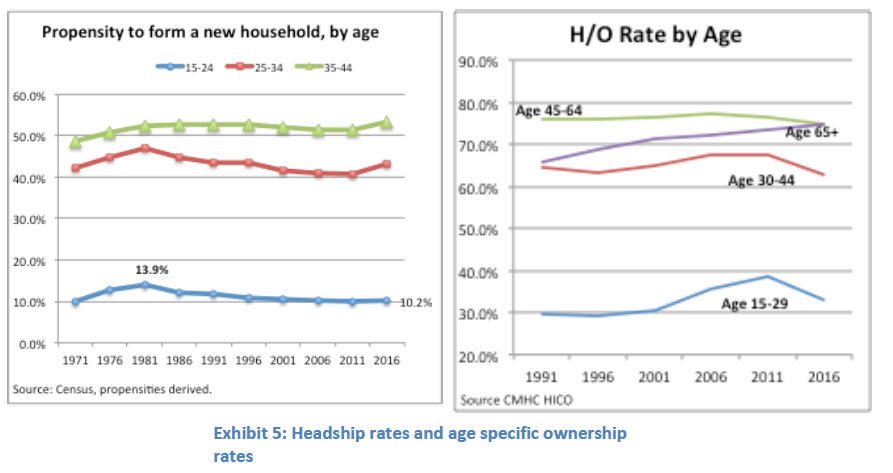
And, while the population of first time buyers aged 15-34 grew, headship rates declined, especially for those with heads aged 25-34 and among those under 25. The trend in the age specific headship rate shows that fewer young people created new households – more remained in the parental home. Overall, with proportionately more households headed by people over 35, this supported a higher homeownership rate.
Socio-demographic factors also played a part as well. The growth of non-family households (primarily singles) with good incomes and a desire to purchase a home (condo) has also been a significant factor.
And, with the wide availability of condominium apartments, seniors, the largest expanding demographic (that in prior generations tended to shift back to renting as they reached old age), have increasingly tended to remain invested as owners, often downsizing from the detached home into condominiums. The age 65+ homeownership rate continued to increase (from 68.6% to 74.6% over the 1996-2016 period).
Remarkably, given the perception that prices are unaffordable to young families, the rise in homeownership rates from 2001 to 2011 increased most among households aged 15-29. As noted, however, this was a shrinking population cohort so, in absolute terms, while a higher proportion purchased, there were fewer actually buying. And together with a low young adult headship rate also means there were also fewer renting (thus weak rental demand, discussed below).
An analysis by Statistics Canada notes that this earlier increasing young adult homeownership rate was heavily influenced by upper income young households (often with help from wealthy parents). By comparison, similarly aged households in lower income quintiles experienced a declining homeownership rate.2
A critical issue for consideration is how this longer-term ownership trend has been influenced by policy and how recent policy changes that have generally reduced access to ownership for FTBs will impact over the next decade. That is, will the declining ownership rate persist?
Lack of data to clearly determine impacts on first time buyers
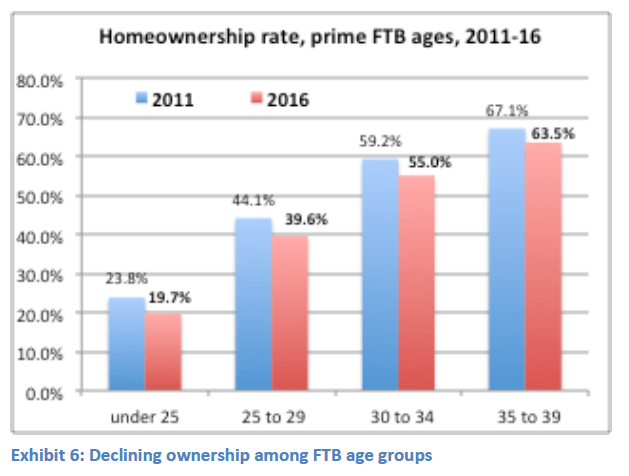 As noted above, somewhat counter-intuitively, the homeownership rate among those aged 15-29 increased from 2006-2011, although for those aged 30-44 the rate flattened and marginally declined. Since 2011 however these trends have reversed, with all traditional first time buyer (FTB) age groups experiencing a reduced ownership rate. It appears that the ongoing rising prices since 2011, and the higher down payment associated with these high prices, together with macro-prudential policies (e.g. stress test qualifying policies) are beginning to constrain access.
There is no survey that specifically captures the proportion of homebuyers each year that are FTBs. The Canadian Associated of Accredited Mortgage Professionals (CAAMP – now called Mortgage Professionals Canada) undertook a survey in 2015 which indicated that as many as 45% of home purchases were from FTBs. In the consultations on the national housing strategy, CMHC suggested that FTBs comprise one-third of home purchasers. There is currently no data source that monitors the proportion of purchasers that are first time versus subsequent buyers (who will have built equity through principal payments and asset appreciation). This is a key area to improve data collection.
Access for FTBs is explored further in a later section, along with rough estimates of the numbers of FTBs.
And what about the rental sector?
The corollary to a rising homeownership rate is a declining proportion of households that are renters. While improved access to homeownership was a critical factor, this also reflected a relative weakening in rental demand.
This included the demographic influence of fewer young households (while the population increased, lower headship rates meant that the number of households aged 15-29 actually declined over the 2001-2006 period). Those in young age groups with sufficient wealth, or parental help, made the transition into homeownership. Reflecting demographics and weak demand, for the first time ever, between 2001 and 2006 the absolute number of renters in Canada fell, though it did edge upward thereafter (2006-2011). And, the propensity for seniors to remain in the ownership market when downsizing further reduced rental demand.
Of particular note, the improved access to homeownership over this period (to 2011) diverted and further reduced rental demand, removing pressure on the rental housing stock and helping to save the rented part of the housing system from the potential consequences of low levels of new rental construction. Of course the more recent reversal means that demand remains, and may grow in the rental sector.
New housing production
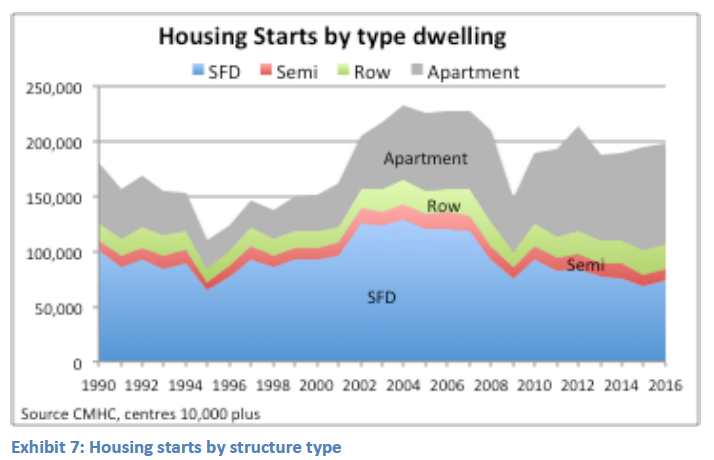
The long-term upward trend in the homeownership rate reflects the dominant pattern in new housing production over the past three decades. Annual housing starts (averaging roughly 190,000 homes over last decade) represent only a small yearly increment in the total housing stock of 14 million homes. But on a cumulative basis, new production patterns have a gradual and significant impact, especially when they are weighted towards particular parts of the housing market.
Up until the turn of the millennium, ground oriented and especially single-family homes dominated new construction. This has gradually given way to multiple units and, especially since the global financial crisis (2008); apartment starts have accounted for a substantially increasing share of total starts. This is due, in part, to the construction of more apartments (particularly condominiums); however, there has also been a decline in the volume of starts of single-detached homes.
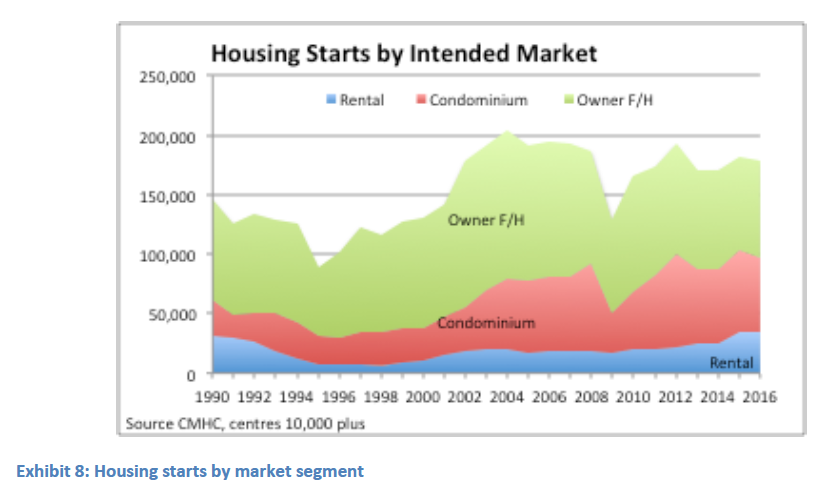 Reflecting the types of dwellings built, over the period 1991-2011, more than 90% of new housing produced was planned for the ownership sector. This was initially dominated by single and semi-detached ground oriented homes, however, apartment units became much more significant after 2000. Condominiums accounted for most of the multi-unit development as purpose-built rental units averaged only 11% of all completions annually (despite the fact that almost one-third of households rent).
There has however been a notable upsurge in the number and share of rental units constructed in the past several years – particularly in the last two years. After averaging just over 21,000 units per year (11% all starts) from 2000 through 2013, rental starts increased to almost 35,000 units annually on average since 2015 (18% of all starts).
Low rental production has not (yet) caused serious issues in the rental sector
With disproportionately more new production directed to the ownership sector and low volumes of rental construction over the past two decades, it might be expected that issues of under supply might emerge in the rental part of the system (with resulting tighter vacancy rates and rising rents) – especially since almost one-third of all households are renters, yet only about one-tenth of new starts have been directed into the rental sector.
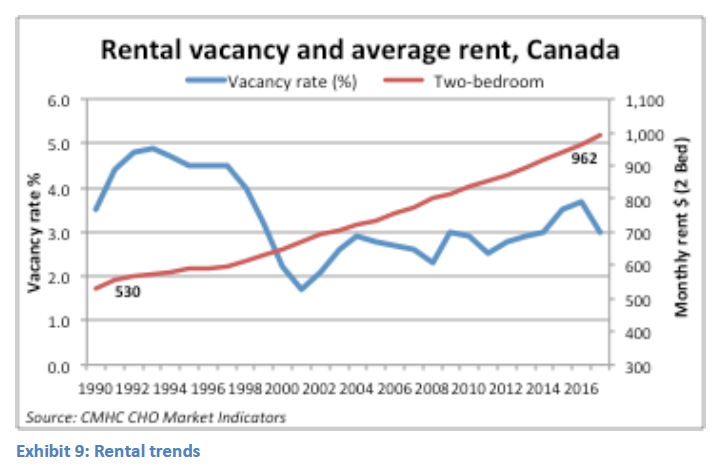
This has not, at least until very recently, been the case. While national data provide an overall average picture, most markets in Canada have reflected a similar pattern – one of fairly healthy, moderate vacancies and only gradually rising average rents. The national weighted vacancy rate has fluctuated around three percent since 2000, and rents have increased (here using the two-bed average) on average by 2.5% annually, close to the rate of inflation.
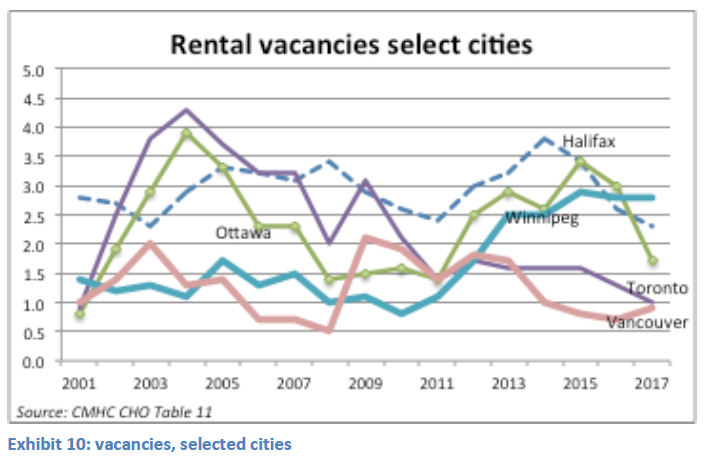 Larger metropolitan regions, especially including Toronto and Vancouver, tend to have lower vacancies, but even there vacancy rates have remained above one percent for much of the past decade – lower than might be desirable but not indicative of an extremely tight rental market. There is however a downward trend in a majority of cities since 2014 (the exception is Alberta and Saskatchewan, due to the weak oil market and reduced employment (vacancies peaked in 2016 in Calgary at 10.3% and in Saskatoon at 7.0%).
This suggests that it is not just new purpose-built rental construction that matters in terms of increased rental supply. Clearly, there is an important additional supply of homes for rent that derives from other sources – including new condominiums and repurposing of homes in the much larger existing housing stock. And as clearly revealed in Alberta, migration flows related to economic conditions also play a significant role.
New production is not necessarily mono-tenure
The statistics on housing production cited earlier reflect the form in which data is collected and published in Canada (mainly via CMHC’s Market Analysis Division). This includes construction by type of dwelling as well as “by intended market”. The latter includes freehold ownership, condominium (another form of ownership), rental and co-operatives (the last category is very small).
As a consequence of the way housing starts are enumerated and published, it is common in Canada to refer to “purpose-built rental housing.” This is a statistical construct, unique to Canada. No other country publishes data on this basis (most simply use structure type (e.g. multiple unit or apartment) and do not distinguish for which part of the market units are intended).
The concept of purpose-built rental housing (versus condominiums) implies that structures are created as, and remain as, rental or owner-occupied. The reality is that this is not always the case; there is a lot of fluidity in the usage of the housing stock. Rental buildings may subsequently be converted into condominium and thereby be lost to the rental sector. Concurrently, many properties ostensibly built for owner-occupation, certainly condominium apartments, but also single/semi-detached homes and row units, are purchased by investors and made available as rentals.
Sometimes separate apartments are created in existing houses, or by dividing up large older homes. Changes in use occur in all dwelling types but, in the past decade, this has become increasingly common in condominium buildings, which have become a significant source of new rental “supply.” Similarly, properties that have been rented may subsequently be sold by their owners (investors) and purchased by owner-occupants, thereby reversing the tenure shift process.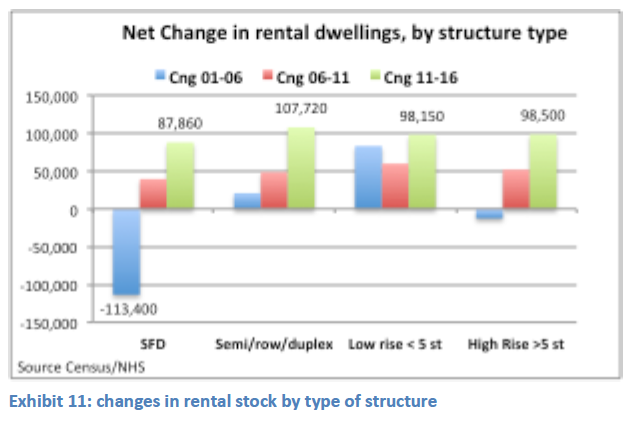
- From 2001 to 2006, over 100,000 single-detached homes (plus another 12,000 high rise condominium units) shifted from being investor-owned rentals to being owner occupied, and this would have aided the rising homeownership rate. Meanwhile (2001-06) the number of low–rise rented apartments increased by 83,000 (some new, some reverting from owner occupants)
- From 2006 to 2011, the net increase in rental units (all structure types) exceeded 200,000 with over half in apartment structures.
- Just under half (95,000) of the total increase in rental units between 2006-11 was from new construction, so the other half reflect change in use in existing units, most moving from owner occupied into investor-owned rentals.
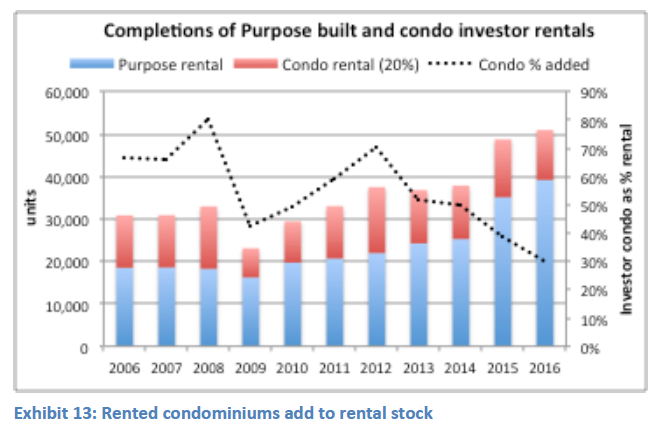
- In the most recent inter-censal period (2011-16) the story is very different: there was a substantial growth in the stock of rented dwellings, and this was almost evenly distributed across all structure groups. In total the stock of rented homes increased by almost 400,000. In the same period, purpose built rental totaled fewer than 130,000 units, so two-thirds of the “growth” came from change in tenure within the existing stock – primarily investor owned homes that were placed into rental use.
In short, there is a dynamic and ever changing nature and tenure mix across the housing stock. This is influenced by consumer and investor motivations as well as by policy decisions. These are discussed later.
Investor Condominiums have become a significant source of rental supply
In most of Canada’s larger cities, where condominium construction is most prevalent, between one-quarter and one-third of condominiums are occupied by tenants, rather than owner-occupied. And this proportion is increasing across all surveyed cities (as shown in chart above comparing 2009 with 2016).
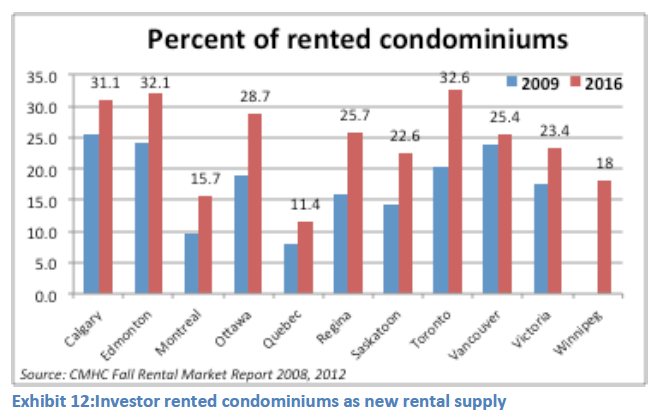
As part of this trend, it is likely that as many as one-fifth of new condominiums are investor purchased and become rentals. Assuming that nationally 20% of new condominiums are investor purchased and made available as rentals, this represents an additional supply equal to 30% to 80% of the purpose-built rental units added each year over the past decade. In part, this is due to increased rental demand and increased participation of investors seeking a capital gain, but it could also reflect a reduction in ownership demand resulting from constraints on access to homeownership brought about by tighter qualifying criteria for mortgage financing for FTBs.
Essentially, the development industry is building tenure neutral structures. These are then sold to some mix of investor owners and occupant owners and this ownership mix continues to change over time as individual units are subsequently sold, again to a mix of investors versus owner-occupants.
Large secondary market
While CMHC monitors rents and vacancy rates in the purpose-built rental stock, as discussed above, this represents a declining proportion of the total rental housing stock. An increasingly large source of rented accommodation is found in what is referred to as the secondary market – apartments in homes, as well as rented houses and rented condominiums.
The universe of purpose-built structures of three of more units surveyed by the CMHC Rental Market Survey totals 1.9 million units. These are in properties that are privately owned and operated at market rents.
The rental survey universe excludes “non-market” social housing in which rents are subsidized (although social housing does include some units that are at market rents). Non-market social housing totals roughly 740,000 units (exact counts are not available). Therefore, the total purpose-built stock is roughly 2.6 million units.
Meanwhile, according to the census 2011 NHS, the total number of occupied rental dwellings was just over 4 million units. Therefore, the total purpose-built stock (private plus social) of roughly 2.6 million units accounts for approximately 60% of all rental dwellings.3
While CMHC conducts a survey of rented condominium units in the larger Census Metropolitan Areas (CMA’s), less data is available about the rest of the secondary market (e.g. suites in homes, and rented dwellings) than is the case for the purpose-built part of the rental sector. There is also very limited data on rents, conditions, and turnover in the non-market social housing sector.
Small and declining non-market social sector
As noted, Canada has a relatively small social housing sector – roughly 740,000 units, representing just 5% of all dwellings and 16% of all rental housing. Most of these units were developed under public and social housing programs from the early 1960’s to mid 1990’s. Typically, rents are subsidized and set at below market rates. Detailed data are available on this first phase of federally funded social housing, which at its peak reached a total stock of 600,000 units.4 In addition, unilateral provincial programs, mainly in BC, Alberta, Ontario and Quebec (also prior to 2000), added another roughly 62,000 units.5
Federal funding for new social housing was terminated in 1994 (and most provincial-territorial cost shared programs were also terminated at the same time).
A new series of F/P/T affordable housing programs commenced in 2002, with assistance primarily in the form of capital grants, rather than ongoing subsidies to offset low rents. These later programs were referred to as “affordable housing” to distinguish from social housing (which had ongoing operating subsidies to lower rents to deeper levels of affordability). Together, these are referred to as non-market housing (as rents are administratively set and typically below market potential). Units developed since 2002 are estimated to total 80,000 units (2002-2016).
The estimated 740,000 unit non-market part of the housing system (5.2% of the total housing stock) includes all social and “affordable” non-market housing constructed. However, the pre-2000 unit subsidies were of fixed term, and these subsidy contracts have begun to expire. Many units still exist, but may no longer be offered at low rent-geared-to-income (RGI) rents and there is evidence of some units being sold. A small number are also in serious disrepair and without new capital investment may be “lost.” 6 So this small resource of non-market units is slowly declining in size.
In 2016, CMHC reports units (net of RRAP and double counted rent supplements) at 526,000, a reduction of 73,000 units “under administration” compared to 1994. These units exclude unilateral provincial and any post 2001 IAH units.
This does not mean these 73,000 units no longer exist or no longer provide low affordable rents, but in the absence of subsidy some will have had to raise rents to cover costs and some may have reverted to market rents (especially those developed by private landlords under the Limited Dividend program, which were included in the “units under administration”).
Beyond the CMHC aggregate “units under administration” there is no data or monitoring system to assess potential changes and losses in the non-market social sector. This is a small but important part of the housing system, providing unique help to very low-income households. It should be more carefully and actively monitored and, where appropriate, remedial actions to avoid losses should be put in place.
While non-market properties offer subsidized or low rents, many privately-owned market units also contribute to moderate rent, relatively affordable rental options. These are typically older properties. Some may have been assisted originally under Limited Dividend or Assisted Rental Program in the 1960’s and 1970’s and, while no longer bound by the original low-rent arrangements, generally would have relatively low rents – reflecting the modest nature of the developments. Secondary suites or apartments in homes also typically have rents, which tend to fall in the lower half of the rent distribution.
Changes in the existing rental stock
Both the annual CMHC Rental Market Survey the Census/NHS provide time series data to monitor the changes in the rental stock. Using Census/NHS data provides a more complete picture of the availability and cost of rental options because it includes the secondary market units. However, unlike the CMHC survey data, it is not available on an annual or timely basis (2016 census data was release in October 2017).
There are a number of factors involved in assessing changes in the rental stock over time. In addition to some units switching back and forth between owner-occupied and tenant occupied, there is also the ongoing process of additions due to new construction, as well as demolition or conversion to non-residential uses.
There is also an ongoing process of rent inflation due to market pressures (to the extent regulatory regimes permit), which can result in units moving out of the lower, more affordable rent ranges.
 The net result of these ongoing dynamics is a change in the availability of rental options – and, especially, a reduction in the number of units in the lower more affordable rent ranges.
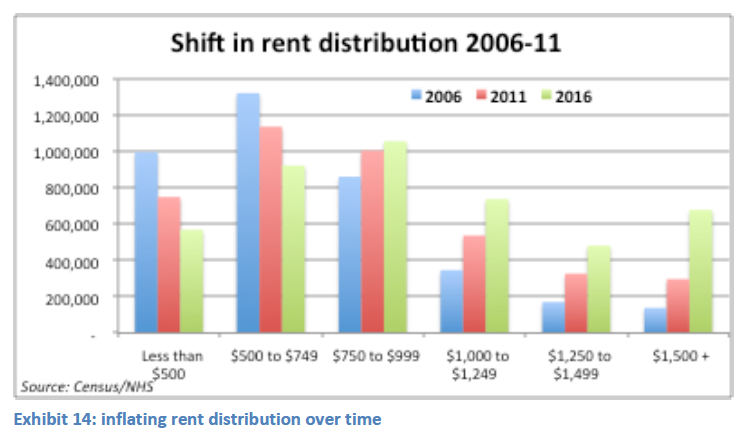
Using Census 2006 and 2016 and NHS 2011 data, with nominal rent values in each year, the existing distribution of rents can be compared over time.7 Using a full national data set, this clearly reveals a reduction in the availability of lower rent units and a shift to higher rent levels. There is a decline in both inter-censal periods in the lower two rent ranges (under $750/month); meanwhile growth is in the rent ranges above $750. This growth comes in part from new construction, but also from investor units entering the market and due to inflation in existing rents.
New additions to the rental stock via new purpose-built rental units and condominium rentals are priced towards the top of the rent range – typically above 140% of the average market rent.8 Also, some secondary units such as rented houses typically rent at levels well above the average market apartment rent. Except for non-market units and some secondary suites in existing homes, net additions to the rental stock tend to be in the upper part of the rent range.
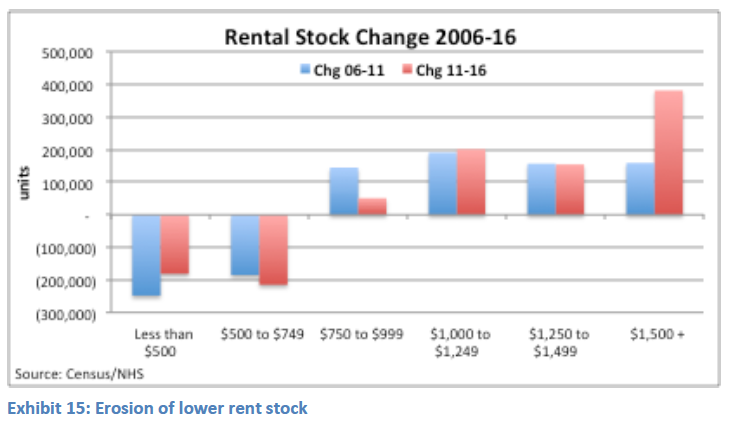
Between 2006 and 2011, the number of units affordable (i.e. rents under $600/month) to households with incomes below $24,000 a year declined by close to 400,000 units. And between 2011 and 2016 the number of units renting below $500 (affordable to an income of $20,000) reduced by 180,000. Over the decade (2006-16) the number of rental units below $750 declined by 830,000.
In most cases, the units still existed but would simply be less affordable, depending on how tenant incomes changed over the same five-year period. However, some will have been demolished, especially in cities pursuing intensification policies, as this typically involves redevelopment of older underutilized sites.
By comparison, it is estimated (Suttor 2016) that additions of affordable units under the FPT Affordable Housing programs added fewer than 50,000 homes between 2006 and 2011). So the net availability of relatively affordable housing declined by some 350,000 units.
Ongoing transactions in rental investment properties
In addition to individual units (apartments or detached homes changing hands and switching between tenures), there is an active multi-unit investor market in which larger investment properties are traded. This includes a full range of structures from those with just a handful of units to large properties with 200 or more units. This adds to the dynamics of the existing stock (and implications for tenants), especially if new property owners seek to undertake changes and rehabilitation to improve potential rent and yield on their investment.
Data on transactions in rental investment properties is not available on a nationwide basis, but is captured by Realnet/Altus for some of the larger centres. Time series data from 2001 for Vancouver, Calgary and Toronto provide some insights on the volume and unit prices of such transactions. These are three different sized rental markets, with Calgary (34,000 purpose-built rental units) having one-tenth the number of purpose-built rental properties compared to Toronto (308,000), with Vancouver in between with 106,000 in the existing purpose-built stock.
![]()
Averaging transactions of existing properties in each city over the past 15 years (2001-16), annual sales represent around 3% of the purpose-built stock in both Vancouver and Toronto, and 5% in Calgary.
Perhaps more significant, transactions of existing structures have far exceeded new rental starts in each centre, except in Vancouver in 2001 and in all three centres after 2012.This reflects the historically low volume of new purpose-built rental starts, until the substantial upturn in new rental construction circa 2013 (especially notable in Vancouver and Calgary).
It also reveals an active investor market. From 2002 through 2012, starts were a small fraction of sales – so existing property sales had a large influence on market values and rents; only since 2013 have new purpose-built rental starts exceeded sales (i.e. ratio of starts is above 100% in chart below).
The other important aspect of these sales is the price trend. The longer-term trend is shown below, indexed against the 2001 starting price.
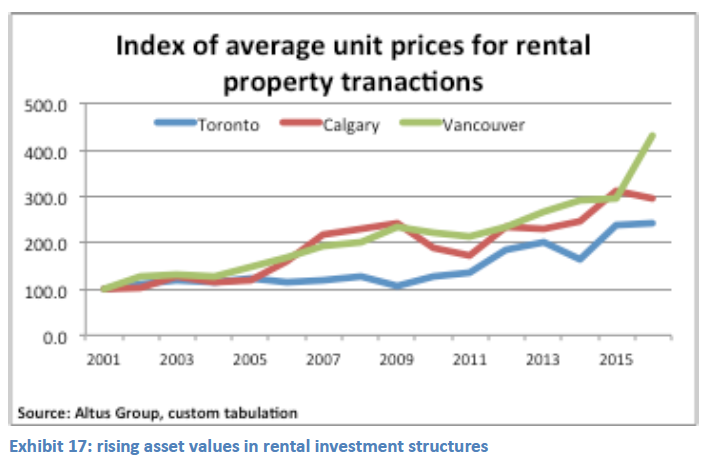
- Like home prices, rental property values, as reflected in the average per unit price have seen a substantial gain. In all three cities average unit prices in 2001 were very similar ranging from$71,000 to $73,000; by 2015 the average values of units in transacted properties were substantially higher although Toronto prices increased somewhat less than Vancouver and Calgary.
- In 2015 Vancouver ($208,000) and Calgary ($225,000) values were up by 300% over 2001 while Toronto lagged at $176,000, a 240% increase.
- In 2016 Vancouver then jumped up dramatically to over $300,000); Calgary slipped (weak demand) and Toronto remained roughly unchanged (at $177,000).
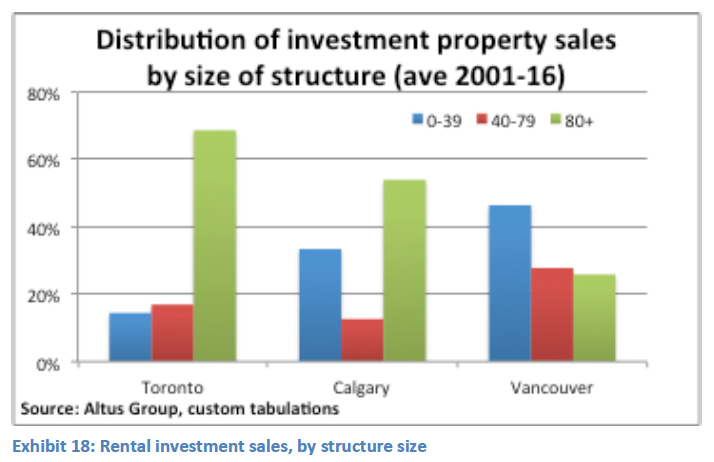
In part, the divergence in average unit values in Toronto reflects a very different mix of property sales. Properties tend to be larger in size in Toronto, and many more sales there were among large structures (80+ units). This was also the case in Calgary. Meanwhile, in Vancouver the sales distribution was dominated by smaller properties, in which average unit values tend to be higher.
 These changes in property ownership have important impacts on the existing stock (and the overall rental market), especially when purchasers undertake renovations to improve rental revenues through higher rents, or purchase properties that underutilize sites in order to demolish and replace with new larger developments. In either case, this contributes to the gradual erosion of lower rent more affordable stock.
A recent report by CMHC provides additional insight into the characteristics of investors, including individuals (mainly “self-managed Mom & Pop” owners), corporations, Real Estate Investment Trusts (REITs) and institutional investors (pension funds and life insurance companies).9 This found that the purpose-built rental stock is almost evenly split between individual investors and corporate/institution/REIT ownership. It is likely that this aligns with the size of structure (individual investors owning small properties; corporate/institutional favouring larger structures).
Similar to the scale of structures, the characteristics of investor-owners are also associated with different rents and values. Rents are substantially lower in structures owned by individual investors (national two-bed average $871), and highest in properties owned by institutional investors ($1,467).
This suggests that there is a large part, almost half of the existing rental stock, at relatively affordable rents, owned by small investors. If there is a policy objective to preserve existing stock in order to preserve this inherent affordability, there is a need to investigate how to assist such small owners to preserve stock (e.g. invest in needed capital improvements). At the same time, it is worthwhile to explore opportunities to acquire such small properties, before they are sold privately, and put at risk of rent increases and leakage out of the more affordable part of the rent distribution.
One option would be to encourage and facilitate non-profit corporations to acquire such properties. To the extent that existing investment property sales, at least in the three cities examined (Vancouver, Calgary and Toronto) have in most years significantly exceeded the number of all new purpose-built rental units constructed, these will far exceed any volume of new non-market construction. Where existing structures are sound, and have moderate rents, enabling non-profit acquisition may be a more effective way to stall the erosion of the existing affordable stock, compared to building new properties.
The price levels for existing per unit sales, at least prior to last year in Vancouver, appear very competitive compared to the cost of new construction under IAH initiatives. So enabling acquisition could have the double effect of slowing erosion as well as spreading limited funding further than if the funds were devoted to new development. This would not add to new supply, but as the foregoing analysis indicates, most markets are in reasonable balance so new subsidized supply is less important than preserving existing affordable supply.
Arguably, new supply is more effectively stimulated without affordability constraints, or with minimal constraints as currently being pursued under CMHC’s rental construction finance initiative.
This suggests the need to separate the objectives of affordability (and relieving persistent issues of affordable core need) from supply. A greater volume of new rental units even at high and intermediate market rents can help to increase vacancies and thereby reduce affordability issues caused by tight markets which result in higher rent increases throughout the rental stock.
3 | Trends in core housing need
 One consequence of the erosion of moderate rent “affordable” existing units is a limited stock of options available to lower income renters. CMHC measures housing need using a core need measure which takes into account three problems – suitability (crowding), adequacy (condition) and affordability (paying 30% or more of income on shelter costs). This also uses a local income threshold by household size to filter out those households deemed to have sufficient income to remedy their housing problem without assistance.
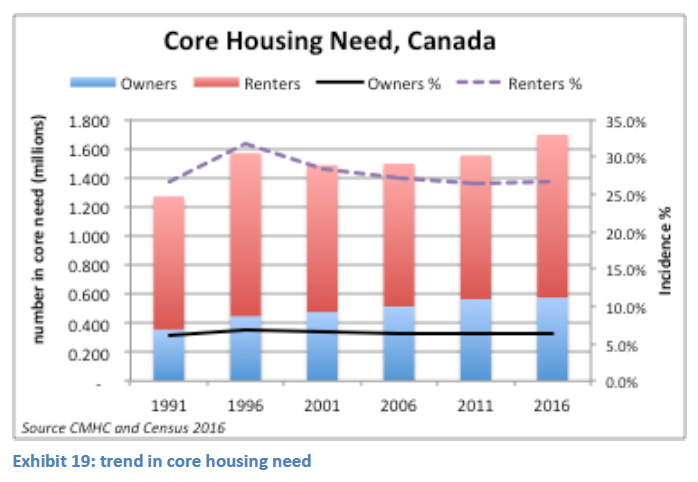
Over the past 25 years, total households in core need have remained relatively intractable: incidence rates have declined marginally post 1996, but the absolute number of persons in need has continued to grow from 2001 to 2011, influenced mainly by a growing number of owners in need.
The most recent estimates calculated from the 2016 census reveal a substantial increase in the number in core need since 2011, and more particularly a substantial increase in the number of renters in need.
The incidence of need is much (four times) higher among renters (27% in 2016) compared to owners (6%). Owners also have some potential assets (e.g. home equity), so renter core need is considered more important than overall rates.
Renter core need influenced by broader economic conditions
In 2016, the latest year for which data is available, some 1.12 million renter households were in core housing need. The vast majority (90%) of these core need renters face an affordability challenge – they have modest incomes and spend 30% or more of this on shelter costs.
It is notable that renter core need rose quite substantially between 1991-96, and this coincides with both the termination of federal funding for new social housing (1994) and a deep lingering recession.
Although the new federal/provincial/territorial (FPT) affordable housing framework did not renew funding until 2002, and even then at only a very modest level, core need among renters reduced substantially (from 32% to 28%) between 1996-2001 – despite the absence of a federal funding program to provide rental assistance or add new affordable units.
After 2001 the incidence of need among renters continued to fall, although in absolute terms there was only a marginal reduction in need (and very few units were created under the new FPT affordable program prior to 2005).
This suggests that it was employment and income gains, rather than investment in new affordable housing that had the greater influence on the level of need. Clearly, efforts to reduce need should encompass options to increase ability to pay (such as labour market support programs), and cannot merely rely on housing or new supply approaches.10
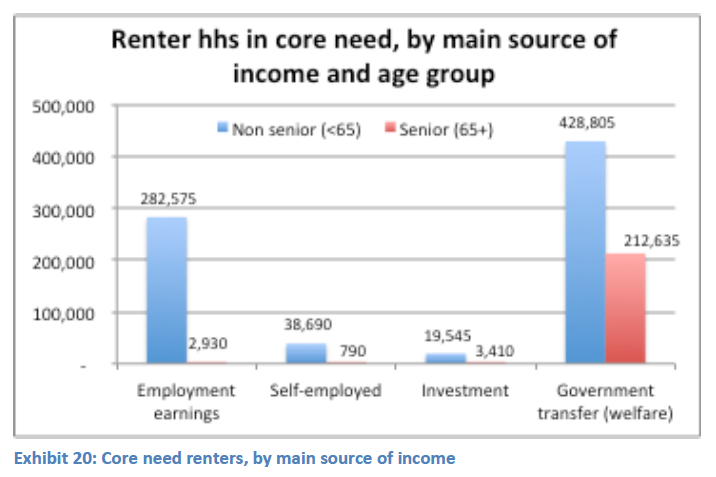 Moreover, data on the primary income sources of core need households reveal that two-thirds of renter households in core need are dependent on government transfers – pensions in the case of seniors and welfare assistance for families and non-senior singles.
Of the 989,000 renter households in core housing need in 2011, one in five (22%) are seniors over 64. Among the remaining 770,000 non-senior households, 56% identify government transfers (a proxy for welfare assistance) as their primary source of income. The structure of welfare benefits, which typically involves a basic living allowance and an explicit housing amount (up to a maximum), is such that the shelter component is always greater than 30% of the total benefit and as a result welfare households are (by definition) captured in the core need statistic. Only where they pay a very low rent (typically when they live in social housing with minimum welfare rents) are they not captured as being in core need.
Accordingly, approaches to reduce the severity and incidence of core housing need should be developed in collaboration with poverty reduction and welfare reform, together with initiatives to reengage and stabilize labour market participation.
Dynamics of core need
While the number of households in core need has remained stable at roughly one million renter households, this is not a static population. Analysis by CMHC using the Statistics Canada Survey of Labour Income Dynamics (SLID) has revealed that the majority of households in core need (primarily affordability) find themselves in need for only a few years. For the period 2008-2010 almost three-quarters (72%) of households in core need were in need for only 1-2 years; the remaining quarter (28%) were in core need for three or more years (largely seniors and those unable to work).
This suggests that the majority of households in core need require only temporary help. A well-designed, well-targeted housing allowance/benefit can readily serve this population. In many cases as their household circumstances improve (usually as a result of improved income) they will phase off of the rental assistance so it is a form of temporary, transitional assistance. Others may replace them but similarly on a temporary basis. 11
4 | Recent price and rent trends
The most notable trend, extensively profiled in the media, is the persistent, and in some markets very large, rate of price increases for homes. While much of the focus has been on Vancouver and Toronto, a trend of rising home prices is evident across most cities. Another, quite different, perspective is provided by using the MLS relative price index, which examines the rate of change for each city, here based on a starting point of 2005. Some cities, notably Calgary and Regina, exhibit a much earlier and (relative to their base price) larger price rise (due to buoyant economic growth), although both have fallen off post 2014 (due to a slowdown in their economies). More notable is that price increases in Vancouver and Toronto matched those in many other cities, at least until 2014.
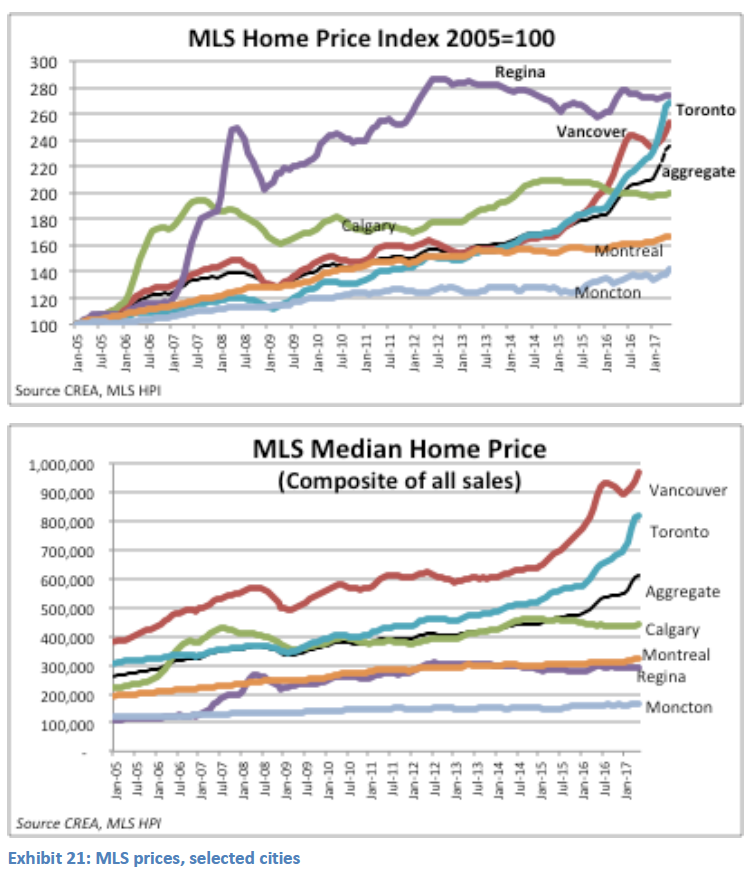
Looking at actual median prices, it is well known that these are much higher in the larger metropolitan regions, especially Vancouver and Toronto. But the price trend was, until late 2014, also rising across most cities (reflected in the cross section of cities shown here).
Price-to-income ratio a poor metric
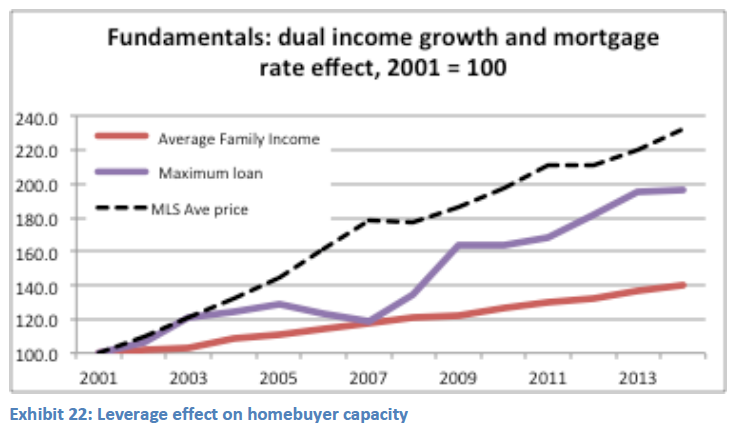 Until 2014, this price trend seen across all cities was driven by similar fundamentals of rising employment, rising incomes and declining mortgage rates. Indeed if annual median income and prevailing mortgage rates are charted to determine potential leverage, there is stronger support for allowing a higher maximum loan amount than the income alone suggests. Looking only at the price-to-income ratio is not an effective measure of the capacity to carry a loan in a period of declining interest rates. A leverage index may better reflect capacity to purchase (combining rising income and declining rates).
Exploring post 2014 price divergence
Clearly something significant occurred in late 2014-2015 to cause prices in Vancouver and Toronto to diverge from the rest of the country. A potential candidate is the dramatic decline in energy prices and the consequent employment and migration impacts in cities closely linked to the oil and gas industries (in Alberta and Saskatchewan).
 A key reason for the earlier and faster rise in prices in Regina and Calgary (2005-2008 – see earlier chart) had been relatively high levels of employment growth tied to the energy sector, which attracted new migrants (especially domestic interprovincial migrants). The fact that prices fell back following the global financial crisis in 2008 and then again after 2014, supports the suggestion that oil and gas industry related employment and migration may be an important factor in the overall house price changes in these centres.
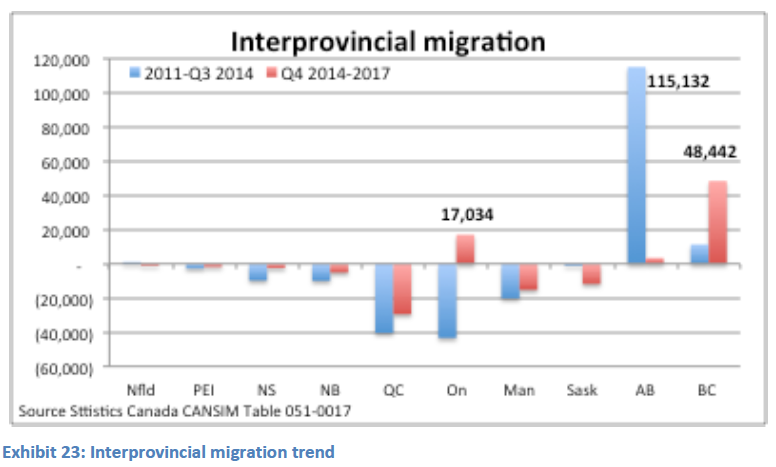
After 2014, with weakened employment (and in fact declines in employment), the significant stream of interprovincial migration which had been flowing to those Prairie cities was diverted – much (if not virtually all) of it to Ontario (mainly Toronto) and BC (mainly Vancouver).
Between 2011 and 2014, Alberta gained over 115,000 domestic migrants; this fell to almost zero in the next three years.
 The major interprovincial migration gains post-2014 were in BC, and this inevitably played an important role in fuelling the real estate price boom there (possibly more important than international migration).
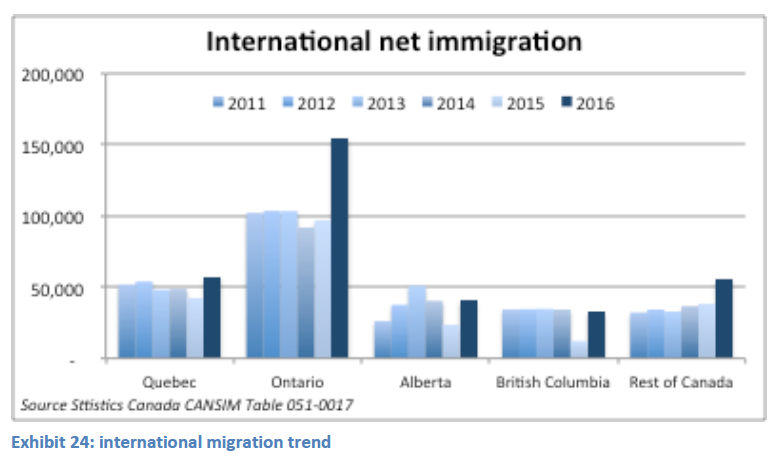
At the same time, international migration added additional demand. While this was relatively consistent over these six years for most provinces, it was significantly higher for Ontario (most going to GTA).12 There is a notable increase in Ontario in 2016, while Alberta registers relatively low levels of net international migration (unlike the pattern of domestic movements). BC maintained similar levels of international migration throughout the 2011-2016 period.
These migration trends help to explain the additional pressures that drove the divergence of the Vancouver and Toronto markets. The bigger impact in BC, as shown above, came from interprovincial migrants, not international; while the slightly later surge in Toronto appears more affected by international migration, especially post 2015.
Short-term effects of migration
Housing markets are inherently supply inelastic – unless they have a large existing inventory of vacant or unsold homes, they simply cannot respond to rapid and substantial shifts in demand due to migration patterns or other factors. As a result, short-term pressures can drive prices to significantly higher levels.
The shift in migration patterns appears to be a very significant factor contributing to the substantial pressure on housing prices in Vancouver and Toronto in recent years.
Intra-provincial migration is not shown here as recent data is not available, but pre 2014 there was already evidence of Toronto losing population to other municipalities further out in the Golden Horseshoe. This has underpinned large price gains in adjoining cities, such as Hamilton.
Home speculation
Rising prices tend to attract speculative buying on the expectation that the price increases will persist.
While the media have fixated on foreign buyers, short-term speculative purchases from domestic sources seeking capital gains are also very important.
Foreign buyers have been suggested as a significant factor in Vancouver (and to a lesser degree now also in Toronto) and these do have an impact, but these tend to be long-term patient investors. They are seeking a safe harbour for long-term investment and capital preservation, and are less motivated by short-term speculative flipping. That said, because the foreign buyers are seeking to park large amounts of capital, they tend to purchase higher priced properties and this has a significant distorting effect on both the market for high-end homes and the data on housing prices.
For example: if ten homes sell for $1 million the average price is $1 million. But if nine sell at $1 million and one sells for $25 million (a realistic scenario in Vancouver), the average price is $3.4 million. Note, however, that the median price is still $1 million. To the extent that media report on average home prices (rather than median), this significantly influences investor/consumer perceptions and expectations of potential price gains, and as such fuels speculative purchase. And this is likely to influence domestic investors more than foreign ones.
Domestic speculators were likely an important influence in sustaining and exacerbating price increases. To some degree new lending rules on investor buyers as well as change in tax filing requirements on non-primary residence may have reduced some of this speculative buying, as have flattening home prices.
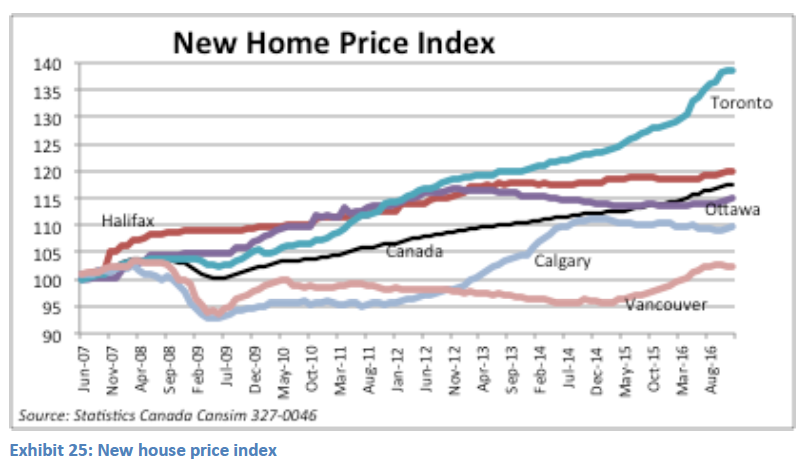
New home price data show more moderate gains
 CAAMP (2015) estimates that recent annual home sales have approximated 620,000 nationally but caution that this is a low estimate (excludes exclusive and private sales, as well as some direct sales of condominiums not listed via MLS).
By comparison, new construction of homes intended for ownership approximates 160,000, so roughly one-quarter of the size of the resale housing market. This suggests that sales of existing homes carry a large weighting and have an important impact on prices, potentially more than new starts.
Rising prices inevitably translate into higher land values and thereby impact the cost of newly constructed homes. The rate of price increase in new home prices has however been a more gradual increase than the overall increase, with less divergence across markets and over time. Only Toronto exhibits a significant increase in new home prices. In Vancouver, after falling post-2008, there is a noticeable upswing post 2014. The new price index covers only detached, semi and row units (it excludes apartment structures).
Supply and inventory effects
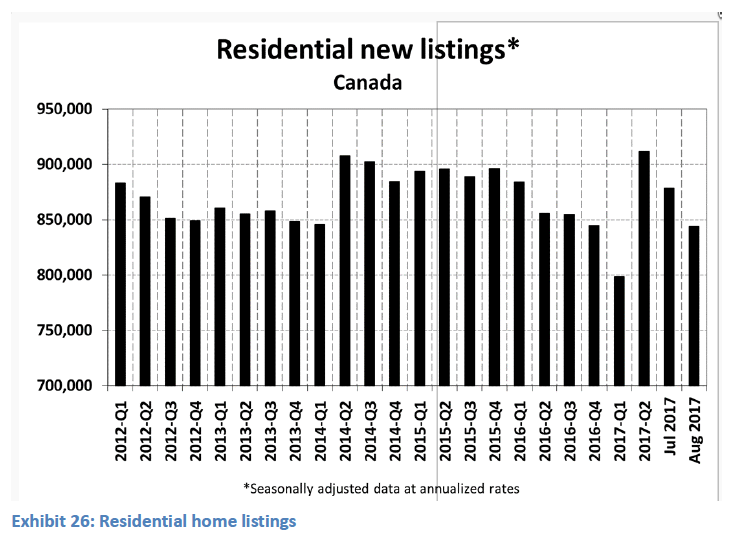
Related to the type of home purchases (new vs. existing dwellings) some analysis has suggested that lack of new home supply, and in particular undersupply of detached homes, which are favoured by a high proportion of buyers, has been a key driver of price gains in the GTA and some other cities. However, this is not the only factor in terms of supply of homes for purchase – the availability (i.e. listing ratio) of existing homes for sale is also very important.
Given the respective contribution of new vs. existing home sales, it is clear that a constrained inventory of existing homes offered for resale can have a major impact on supply – and prices. New listings of homes for sale declined substantially during 2016 and into 2017, especially in the GTA. This, no doubt, had a significant impact on price pressures – especially given the high demand related to migration patterns, and the speculation due to the rising prices. The dramatic increase in new listings in the second quarter of 2017 was a major factor behind the softening price pressures in this period (particularly in Toronto).
That is not to say that new construction and the supply this creates is not important, but it needs to be placed in context of the inventory effect and role of existing homes in influencing the overall performance of the housing market.
Impact of move-up buyers
Homebuyers that already own and are changing their home also impact on home prices. Some may be moving up (e.g. couple sells condominium to purchase a larger townhome or detached home to start a family); others may be downsizing (e.g. empty nesters, or separating families). As noted earlier, with FTBs accounting for between 30-45% of total home purchases, these subsequent buyers account for the majority of sales (55-70%), and their consumption (re-purchase) patterns have a significant impact on prices.
In examining home price trends and how these themselves constrain access, it is also notable that data on price changes in the GTA reveal prices in the insured space have remained relatively flat while average prices Toronto grew in the double digits in 2016 – thus, FTBs (mainly insured buyers) were not the ones driving home price appreciation, it was driven more by secondary move-up buyers and investors.
These subsequent buyers have a greater capacity to absorb higher prices, and indeed drive up prices than FTBs because, if they have owned their home for a significant period, they have benefited from substantial rates of price appreciation. Also, in the low interest rate environment that has existed over the past decade, their mortgage payments have more rapidly reduced the principal balance, adding to their net equity. There may be a small number of very recent buyers that purchased at the peak that may have seen the asset value decline. If these are patient and long-term purchasers this paper loss may not create serious concerns.
Appreciation begets more appreciation as recent vendors reinvest their windfall of increased equity. The net increase in the cost of their housing is diminished by the availability of a substantial amount of accumulated equity – for them, buying a home at $1 million is not that difficult if they have just sold an existing house for $800,000 (which they may have purchased in 2001 for less than half that amount).
That said, at some point, constrained access for FTBs due to high prices and/or underwriting constraints will impact the move-up buyer, and the overall housing market – if there are no FTBs to buy the home they seek to sell. Without FTBs, there is effectively no demand for new dwellings – they are an essential component in the operation of the housing system. As noted earlier, it is critical that better monitoring and data be available on access/constraints for FTBs.
Increasing down payment burden on first time buyer
While the declining and historically low mortgage rates and associated leverage effect have had a positive impact in increasing affordability, they have also had the offsetting effect of contributing to rising prices by enabling those consumers able to buy (subsequent buyers who, as discussed, have substantial equity, and FTBs, in some cases with family financial assistance).
But higher prices have resulted in higher down payments, especially alongside policy changes that have eliminated loans at 100% of value and in loans in higher cost markets where the maximum loan-to-value has been reduced from 95% to 90% on properties exceeding $500,000. To the extent that this price threshold is above that pursued by the typical FTB, this requirement may have a more limited impact – as noted, move-up buyers generally have sufficient equity to provide a substantial down payment.
But for FTBs, and especially those without family financial help, the higher down payment amount may be becoming a serious constraint to accessing ownership. This issue is further exacerbated in those markets still experiencing large rates of appreciation, as the prices move further away even as they seek to accumulate a down payment.
Using the average price of a townhouse (to reflect more entry level pricing) and the median family income of couples with and without children aged 25-34 (typical FTB age) the percentage of income and years required to save can be determined (2014 incomes are used here – the latest data available).
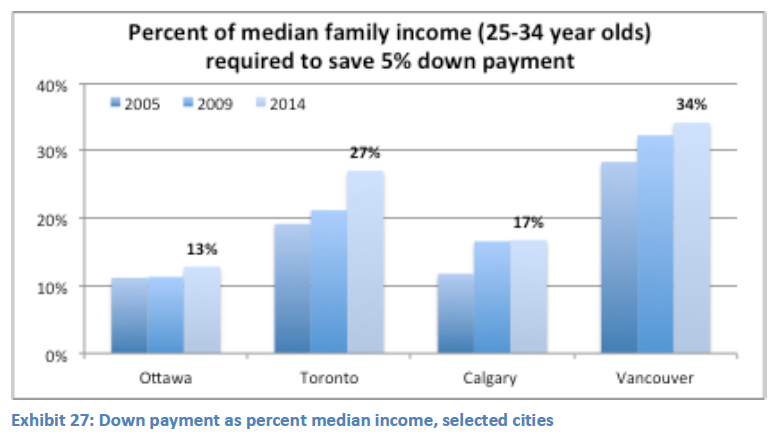
Notably, despite high housing costs, the median incomes in Vancouver are lower than the other three cities profiled here. The combination of price and median income translates to less affordability and requires the median young family in Vancouver to save 34% of their 2014 income before they can purchase. This is up from 28% in 2005.
Assuming they can save 5% of their income per year it would take almost 6 years to accumulate the required deposit. Meanwhile, of course, home prices are rising – up 60% in Vancouver since 2014.
Ottawa and Calgary are considerably more affordable to young families (again a combination of better incomes and lower prices) – those with median incomes would require between 2.5 to 3.5 years to accumulate the minimum 5% down payment.
The fact that median household incomes of young adults are low in Vancouver, relative to other cities, may be an early warning signal that young families are being driven out of Vancouver by their aspiration to own – an aspiration that they can attain only by moving somewhere else. Ultimately this will have implications for the labour market and supply of young well-educated talent.
As mortgage rates begin to trend upward, albeit slowly, this may also add a moderating effect on prices. A buyer’s ability to afford something is based on the size of mortgage payment they can afford, not on the price tag of the home itself. Thus, as interest rates go up home prices might fall, but the carrying costs of mortgages may not be impacted – the only change is that a greater percentage of the payment goes to interest and not equity.
Rent Trends
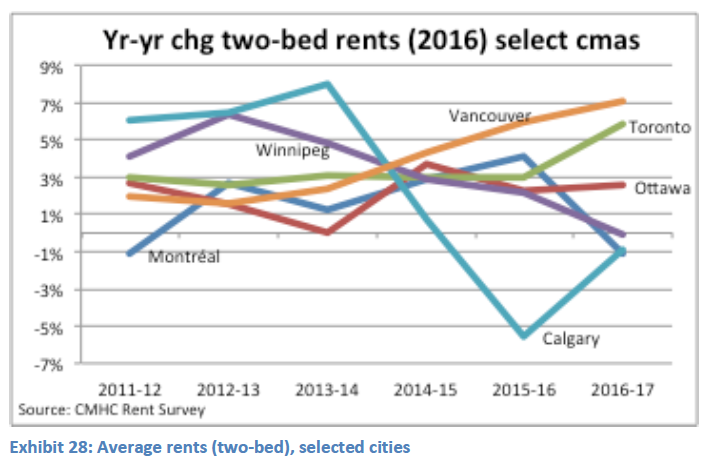 Earlier it was noted that rents did not rise dramatically as a consequence of low levels of new rental construction, and this was largely attributed to relatively balanced rental markets, as well as increased supply from non-conventional sources (including tenure shifts and new investor condominiums).
In recent years, as the shift to homeownership has slowed, and more households have remained as renters, there is evidence in some markets of tightening in vacancies and larger rent increases. These have not been consistent annual increases – there is a more volatile pattern across a cross section of cities. And there is considerable variation in actual rents, both in absolute terms and relative to local incomes. Metro areas in Quebec and the Atlantic tend to have substantially lower rents than those in Ontario and western Canada. Two bed rents in Vancouver are almost double those in Montreal. And in Vancouver and Toronto annual rent increases have exceeded 5%.
Incomes similarly vary across cities, albeit not necessarily in line with rent levels. Median renter household incomes (Census data are for 2015 income) are highest in Calgary, which results in the lowest average rent/income ratio. Montreal has modest incomes, but lower rents.
The high rents in Toronto and Vancouver are responsible for the highest average rent/income ratio. This income-rent disparity means that it is even harder for young families to save a down payment to achieve ownership.
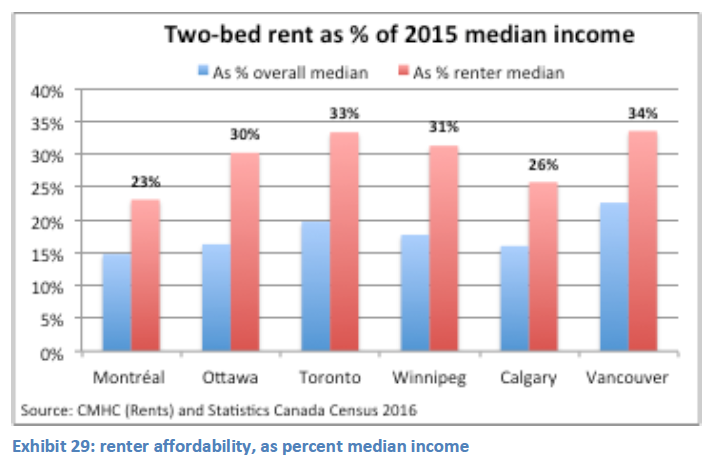
Expanding influence of investor suppliers
As noted earlier, much of the recent new “supply” of rental units has come via investor-owned condominiums. These are newer and often higher quality than the existing purpose-built rental stock, and as a result tend to command higher rent levels.
Across the selected cities, using the average rent from 2011-2016 in each segment of the rental market, we see that condominium rentals are often 120% to 140% of the average rentals in the purpose-built stock – which tends to be dominated by older buildings (much older and with fewer features and amenities than newer condominiums). Meanwhile other units in the secondary market (detached dwellings as well as apartments in homes) are within 10% of the average purpose-built rent.
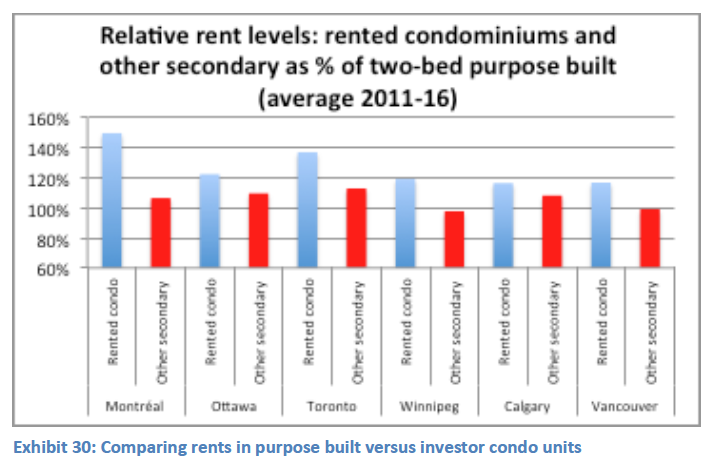 Looking at the recent trends in rent levels, it is possible to separately examine trends in three sub-sectors of the rental market: the purpose-built rental sector; a sample of rented condominium units; and the rest of the secondary market (in which higher rents for detached homes are balanced by generally lower rent suites in homes).
Across these three market segments there is substantial price differentiation. In general, investor-supplied rented condominium units (and new rentals) tend to be the more expensive option (in part because these are newer stock, and typically higher quality). These range from 120% to 150% of the average two-bedroom rent from the purpose-built universe.
In most cities sampled here, rents in the secondary market are about 10% higher than the purpose-built two-bed average. This is because a large number are detached homes occupied by renters. Only in Winnipeg and, perhaps surprisingly, in Vancouver are the rents of secondary units similar to or below two bedroom rents (i.e. less than 100% in charts). In the case of Vancouver, this is partly explained by the high two-bed rent level in the purpose-built stock and may be influenced by a larger mix of apartments in homes (as distinct from rented houses).
One consequence of rising home prices (exacerbated by macro-prudential policy changes) has been decreased access to homeownership – to what extent has this translated into rising rent pressures? Again looking at the three sub-sectors, we see considerable volatility from year to year. In part, this reflects changes in the composition of the secondary market universe as units ebb and flow between owner-occupation and being rented out. The charts show much larger year-to year increases in the secondary market – especially in Ottawa, Toronto and Vancouver in 2016 and as such may reflect early evidence of constrained access to ownership with demand remaining in the rental sector.
The charts reveal much less volatility in the larger purpose-built sector and only modest year-to-year rent increases. This is likely associated with rent regulation, which is less evident in the investor and secondary part of the rental sector. The purpose-built part is a more consistent universe and as such a more useful basis for an indicator to monitor rent levels and trends.
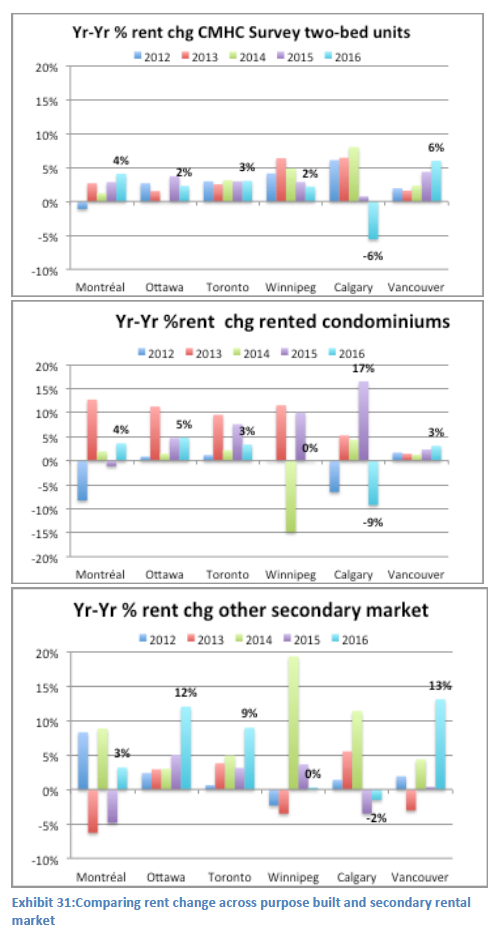
5 | Policy Changes impacting the housing system
The various trends and outcomes described in the preceding sections have largely reflected the influence of market conditions, including both demand and supply influences. However there has also been some impact from various government policy and expenditure decisions.
There have been very few changes of intentional policies directed to the private rented sector in recent years, with the exception of some regulatory changes in a few provinces to strengthen consumer protection, and a rental investment tax credit program in Manitoba.
Expenditure impacts have been most notable in the social-affordable housing sector, and these will be expanded under the NHS.
The most significant policy changes have been those directed to the homeownership parts of the housing system (lending rules and stress tests) and more recently the announcement of a National Housing Strategy, which will commence implementation in 2018.
5.1 | Policy and expenditure trends in affordable housing
As noted earlier, the 1993 federal budget was a watershed event for the social-affordable housing sector, terminating all new funding for social housing. This was followed in 1995 by a directive to CMHC to negotiate the transfer of administrative responsibilities for existing social housing to the PTs (a process that stretched out over more than a decade, with two provinces remaining without agreements, Quebec and PEI).
The key element of these Social Housing Agreements (SHA’s) was to shift ongoing oversight over project level agreements to the PTs and to effectively freeze the level of federal funding. PTs were then required to absorb any inflationary increase in subsidy requirements, but generally these were more than offset by the opportunity to retain any “savings” which arose primarily from renewing existing mortgage loans at declining rates.
The critical aspect of the SHA’s that is pertinent in the current period is that the federal subsidies were linked to long-term project operating agreements (typically 35-50 years in duration) with the subsidy terminating at the maturity of the agreement. The agreements began maturing around the turn of the millennium, albeit at an initially slow rate, but the pace of maturing agreements has accelerated and is now at its peak. The subsidy duration matched the loan amortization, so in many projects the concurrent end of subsidy and end of mortgage payments can have a positive effect and leave projects viable. This generally occurs in mixed income projects with a lower proportion of rent-geared-to income (RGI) tenants. In certain portfolios such as Public Housing and Indigenous portfolios, the majority are 100% RGI and will face difficulty to remain viable at expiry.
This issue, labeled the expiry of operating agreements (EOA), is now having a profound effect on the viability of some non-profit and co-op projects including their capacity to sustain low RGI rents and to reinvest in maintaining assets in a sound condition. Others are now able to explore new opportunities with some cash flow (resulting from the elimination of the mortgage payments) and the absence of a regulatory framework (no more operating agreement).
Recent federal budgets have acknowledged these potential impacts and have implemented some interim measures to manage these in those parts of the social housing portfolio for which the federal government, through CMHC, retained administrative responsibility. All other projects and units fall under PT administration and it has been left to the PTs to respond to any issues. The 2016 federal budget did however allocate some funds and also initiated a process for developing a national housing strategy, with the 2017 budget augmenting this with an announcement to preserve the EOA-related baseline federal expenditures.13 While part of this baseline funding envelope may be repurposed, current discussions center on first ensuring sufficient funding to preserve the existing social housing stock.
With respect to investments in new social housing projects, the federal government re-engaged in 2001 with a new funding framework to support some new activity, in partnership with the Pts. This commenced with a set of bilateral agreements in 2001, with subsequent amendments and extensions on 1-5 year durations. The amendments gradually increased the flexibility and autonomy for the PTs to determine the optimal form of investment for the cost shared funds.
The latest renewal was for the 2014-19 period. This set out a funding quantum and range of eligible program areas for those 5 years. This funding level, initially set at $253M per year was effectively doubled in the 2016 federal budget. In addition to expanding funding for Investments in Affordable Housing (IAH, the cost shared FPT fund), Budget 2016 also announced the development of a national housing strategy (NHS). It augmented IAH with two years of social infrastructure funding, totaling $2.2Billion and introduced a new fund to support innovative new developments (total $200M over 5 years) as well as a new financing initiative to provide low rate loans in support or rental housing (total $2.5B over 5 years). 14
Budget 2017 set out the funding framework to support the national housing strategy, which was subsequently released in November 2017.
The National Housing Strategy
While titled a national housing strategy, the NHS is heavily focused on the affordable part of the housing system It will create a number of funding envelopes and program mechanisms to preserve affordability and upgrade the existing social housing stock, provide capital funding and loans to expand supply of affordable and some market rate rental housing, and extend the ongoing IAH. Funding under the IAH (FPT partnership) envelope will however be partially diverted commencing in 2020 to fund a new housing benefit as a way to directly address affordability issues for low income renters. New funding in the amount of $11.2B will be augmented by reinvestment of previous scheduled reductions of federal funding under long-term subsidy agreements and by PT cost matching on some elements of the strategy.
The NHS targets a substantial reduction in the incidence or severity of core housing need (assist 530,000 households) as well as reducing homelessness by 50% over the next decade. Details of specific programs and the renewal of the Homeless Partnering Strategy remain to be detailed. In addition, a separate indigenous housing strategy is also being developed. This totaled an initial commitment of $11.2B over the coming decade with a series of funding envelopes both extending the established FPT IAH framework as well as new envelopes targeting a range of new federal priorities.15
Additional resources are allocated to improve data collection and analytical support and research to improve awareness and understanding of trends and issues impacting the housing system, including the private rental and ownership parts of the system.
5.2 | Review and summary of key lending and macro-prudential policy changes
Many of the trends and dynamics described earlier occurred naturally in response to market pressure and evolving consumer-investor behaviour, as well as other extraneous factors like monetary policy and the steady decline of mortgage rates – rather than specific housing-based policies. There is minimal evidence of any specific housing policy-driven effect or outcomes, at least until very recently.
Some earlier policy changes related to the introduction of the GST and, in many provinces, harmonization of provincial sales taxes with the GST, together with a trend of rising local government fees and charges, all of which had impacts on the cost of new development.
In particular, the dramatic increase in the homeownership rate was not an outcome of a specific policy directive or intervention. Unlike the US, where two consecutive presidential policy priorities explicitly pursued an increase in both the minority and overall homeownership rate (Clinton 1992-2000, and Bush 2000-2008 administrations), there was no parallel policy impetus in Canada.
More notable housing-specific policy initiatives have occurred in the past decade, and while housing related, most were inspired more by concerns about record levels of household debt and potential risks of a housing bubble with negative consequences for the broader economy.
Changes to Insured Mortgage Lending Regulations
Under the Bank Act, federally chartered lenders (including the six major banks) are required to restrict their residential mortgage lending to a maximum of 80% of the value of a property (raised in 2007 from 75%) unless they obtain mortgage insurance (more properly defined as “default insurance”) which guarantees the lender against loss in the event that the borrower defaults on the mortgage. For homeowner loans, mortgage insurance is available from CMHC and its private sector competitors, Genworth and Canada Guaranty. Only CMHC offers mortgage insurance on rental housing projects.
While not required to do so under federal legislation, in practice, provincially-regulated financial institutions, such as credit unions and trust companies, tend to follow the regulations established for federally-regulated institutions.
Insured lending policies were loosened initially in 2006 to improve access to financing with the elimination of any down payment deposit on home purchase and extension of the maximum amortization period on insured loans to 40 years. This was a very significant change, equivalent to a 3% reduction in the mortgage rate. It came at a time when home prices were already on an upward trajectory, although they had paused due to a short-term bump in mortgage rates in 2006-07. It might be argued that this 2006 change was ill advised and was tantamount to pouring fuel on an already burning fire. This may have contributed to fuelling home prices at a time when they already had substantial momentum.
Since 2008, in response to concerns about escalating prices, the financial well-being of Canadian homebuyers, the stability of Canada’s housing markets and impacts on the broader economy, the federal government has enacted a number of changes in the regulations for government-backed mortgages (effectively all mortgages insured by CMHC and the private mortgage insurance companies).
Over the period from 2008 to 2012, the changes introduced by the federal government included:
- Reversing the maximum amortization period from its recent 40 year peak – first in 2008 to 35 years, then in 2011 to 30 years, then in 2012 to 25 years;
- Maximum loan-to-value ratio for mortgage refinancing reduced – first to 85%, then in 2012 to 80%;
- Maximum total debt service ratio (for the total of all loan repayments including mortgages, automobile and other loans) capped at 39%;
- Maximum home prices restricted to less than $1 million;
- Interest-only and zero down payment mortgages abolished;
- Borrowers required to qualify for a 5-year fixed-rate term mortgage, even if they choose a shorter term with a lower interest rate;
- Minimum down payments of 20% for non-owner-occupied, investment properties;
- Elimination of mortgage insurance for home-equity lines of credit.
While all of these changes had the effect of tightening the rules for mortgage lending, the most significant by far was the reduction in the maximum amortization period. Prior to the federal government action, increasing proportions of borrowers were taking mortgages with amortization periods beyond the 25-year limit imposed in 2012.
Following the 2015 federal election, the new Liberal government introduced further changes to the requirements for insured mortgages:
- Increase in minimum down payment for mortgages valued at $500,000 or more – effective in early 2016, the minimum down payment for new insured mortgages increased from 5% to 10%for the portion of the house price above $500,000.
- “Stress test” for insured mortgages – in October 2016, the federal government required that, rather than apply a maximum gross debt service ratio to the actual (or contract) mortgage interest rate in qualifying borrowers for a loan, lenders were required to ensure that borrowers’ incomes are sufficient to meet specified debt service ratios for the greater of the actual mortgage rate or the Bank of Canada’s conventional 5-year fixed posted rate.
The “stress test” requires that a borrower’s gross debt service (GDS) ratio (the carrying costs of the home, including mortgage payment, property taxes and heating costs relative to the borrower’s income) must be no greater than 39%, based on the greater of the actual mortgage rate or the Bank of Canada’s posted 5-year rate. In addition, the total debt service (TDS) ratio (the carrying costs of the home plus all other debt payments, relative to the homebuyer’s income) must be no greater than 44%. The new requirement was intended to ensure that homebuyers have a buffer to be able to continue servicing their debts even in a higher interest rate environment, or if faced with a reduction in household income.
More recently in July 2017, the Office of the Superintendent of Financial Institutions (OSFI) has proposed that this stress test be extended to all mortgages (i.e. including those that are not insured). This proposal remains under consideration and if approved would come into effect later in 2017. It would most likely impact mainly the higher cost markets of the Greater Toronto Area and Vancouver (which have been dominated recently by non-insured borrowers).16 Analysts have expressed concern that the stress test policies could have the unintended effect of over correcting home prices with potential negative consequences for the broader economy (as sales and starts may decline).
Genworth have reported that roughly one-third of loans insured in first half of 2016 would have been offside (with borrowers breaching debt servicing caps) had the changes come into effect on Jan 1 2016. Thus, some borrowers would buy a less expensive house now, some would try to find a way to make a bigger down payment, and some would have to save for longer or not buy at all. Both CMHC and Genworth have experienced a sizeable drop off in premiums written since the changes were made, but the full effect remains to be seen since change of that magnitude takes about a year to two years to be fully understood/fully integrated into the market. As noted earlier, such policy changes in the ownership sector can have important consequences for the rental sector.
Provincial policy change
At a subnational level, there have also been notable policy initiatives aimed at managing the concern that foreign buyers may have an impact in sustaining an unhealthy rate of home price increases in Vancouver and the GTA, which may cause a de-coupling of prices from local consumers capacity to pay. Both involve a new tax of foreign buyers as a way to discourage such practice, or at least to generate some revenues that the province can then invest in some counter measures (e.g. BC collected over $800M from the first six months of the foreign buyer tax and have allocated $500M to new affordable initiatives being delivered by BC Housing).
In the rental part of the system, there were some initiatives at the provincial level to encourage rental construction including reform of rent regulation in Ontario in 1998 and implementation of tax credit incentives in Manitoba (implemented in 2013 – this provides a non refundable tax credit up to $12,000 per unit to developers of new rental units). The Manitoba initiative however was concurrent with a 5-fold increase in the volume of new rental starts (though it is unlikely to have been the key factor behind this increase, since similar increases in rental development occurred elsewhere).
At various times, provincial governments have revised their rent regulations. Ontario significantly liberalized these in 1998, but there is little evidence that this stimulated any significant increase in rental construction. Earlier in 2017, Ontario has again announced changes, removing the exemption of rental properties constructed after 1991 from rent regulation. Some have argued that this could stall the recent increase in rental construction; however, it is too early to judge the overall impact of this measure. A key factor in the earlier (1998) reform of rent regulation in the province (resetting of rents to market when a unit is vacated, and subsequently limiting increases only for in-situ tenant) was retained in the new regulations so this will likely mitigate the negative effect of the recent change to some extent.
Nonetheless, there is a degree of policy inconsistency – as federal policy change targets the FTB, and potentially shifts demand back to the rental sector, provincial policy change may constrain new supply and the ability to absorb residual demand from potential FTBs not transitioning to ownership.
Provinces and territories have also been an active partner in delivering and cost sharing new investments in affordable housing, and will continue to play a partnership role under the new NHS programming that is being implemented starting in 2018.
6 | Focusing on first time buyers
Throughout this brief the issue of whether access to ownership, particularly for FTBs, may be increasingly constrained has been highlighted. Access to ownership for this segment of the population has important implications and consequences, which reverberate across the housing system.
It has been noted that the ownership rate increased at an unprecedented scale between 1996 and 2006 (from 63% to 69%). This is associated with a period of strong fundamentals: a recovered economy aiding employment and income gains abetted by declining mortgage rates and fuelled by pre 1996 pent-up demand. After 2006 the homeownership rate has remained relatively stable at around 69%.
During the 1996-06 decade, almost all net new household growth flowed into the ownership sector; rental demand was very weak. This large shift into ownership had an important impact on the rental sector, removing pressure on rents and offsetting the low level of rental starts. Over these ten years had the ownership rate remained at the 1996 level (63.6%), this growth of households would have added demand to the rental sector totalling 879,000. This is equivalent to constructing 88,000 new rental units each year!
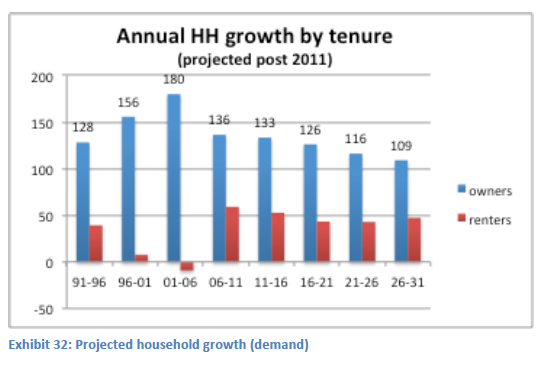 Since 2006, however, the traditional split of household growth between the options of owning and renting has rebounded with just under one-third (30% remaining as renters and two-thirds (70%) accessing ownership. Whether this share remains at this level will depend on the capacity of young households to access ownership – i.e. to become FTBs.
The primary reason for the 1996-06 increase in the ownership rate was the participation of new buyers in the ownership market. Move-up buyers (those moving from one home to another – such as upgrading from a starter home to a larger home more appropriate for a family) and move-down buyers (such as empty-nest households moving to a smaller home such as a condominium) are important actors in terms of the types of new housing that might be built, and as noted earlier in contributing to price increases as they reinvest appreciated equity. However, ultimately, they do not in themselves create net new demand for additional ownership housing because they sell a home at the same time that they buy another – they supply a unit at the same time they demand one.17
The demand for new ownership housing (i.e. the need to increase the stock of ownership dwellings) is driven by a variety of factors:
- Replacement of dwellings lost to the stock through demolitions;
- Replacement of dwellings switching from ownership tenure to rental tenure (this can be a negative number if more dwellings switch from rental to ownership tenure);
- Increases or decreases in the number of vacant ownership dwellings;
- First-time buyers – households purchasing their first home; and,
- Death or a move to rental housing for existing homeowners.
The first three factors identified above (replacement of demolitions and tenure shifts, and changes in vacancies) are relatively small in relation to the last two – FTBs and the supply of dwellings created by the death or move to rental for existing homeowners.
There are no reliable time series estimates of the numbers of FTBs and the supply created by existing owners; however, rough estimates can be derived by examining the changing numbers of homeowners in each age cohort over time. For example, homeowners in the 15-24 year age group at the time of the 2001 Census (70,990 in Canada as a whole) can be assumed to have been FTBs in the period since the 1991 Census. Similarly, looking at the number of homeowners in the 25-34 age group ten years later in 2011 (1,002,795) facilitates an estimate of the number of FTBs in this cohort in the intervening period (1,002,795 minus 70,990 = 931,805).
Using this process, rough estimates have been prepared of both the numbers of FTBs as well as the numbers of ownership dwellings becoming available from those aged 65+ – either through death or moving to a non-ownership dwelling (renting or going into a nursing home).
- The number of potential FTBs has been in the range of 200,000 to 280,000 (with the current decade 2011-21 being at a peak of 260,000. 18
- Subtracting homes released back into the market by the aged 65 and over cohort has followed an upward trend, reflecting the aging of the baby boom, and this will peak in the 2021-31 decade.
- The net result is the net demand for new ownership homes, which since 2001 and through the current decade (2011-21) is just over 150,000 per year.
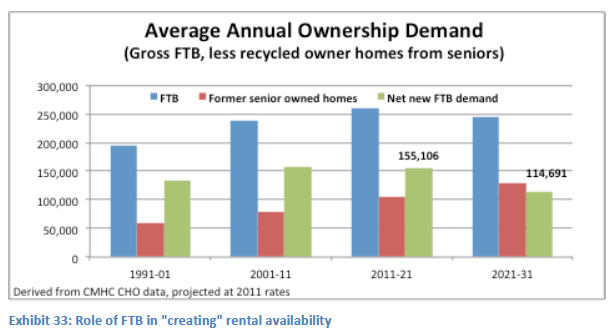
FTBs are the key driver of the demand for new ownership housing. Without a first-time buyer somewhere in the chain of transactions, there is no need to build new housing (beyond replacement of obsolete stock). So the critical question is will these roughly 250,000 potential FTBs achieve their ownership aspiration and sustain demand for both new construction and enable move-up activity.
If the ownership rate of these FTBs declines (e.g. back to 1996 levels), the demand for new ownership will shift into residual demand for rental housing.
To manage these related issues, policies will need to enable aspiring owners to purchase (i.e. need to monitor and where necessary adjust macro-prudential policies to support millennial purchases) and to encourage a sufficient supply of rental housing.
7 | Consolidation and insights
The review of data and trends in the preceding sections reveal a number of issues and highlight the critical overlap and interdependencies of each segment of the housing system. The data reveal some important changes in long-term trends, most notably the reversal of a rising ownership rate, increased demand and pressure on the rental market, and a substantial increase in renter core need.
It also highlights the critical role of young newly forming households and FTBs in sustaining a healthy housing market – as well as the need for policies to accommodate and facilitate their participation.
Younger households are the primary source of new rental demand. Many subsequently aspire to ownership but may be constrained by a combination of high prices, large deposit requirements (related to high prices) and cautious macro-prudential policies that tend to target the FTB, even though they may not be the most significant cause of rising household debt.
Key issues raised in the analysis are highlighted below.
Changes within the existing stock are very significant to the operation of the housing system:
- In the ownership sector, resales of existing homes (est. 600,000+) involve more than four times as many units as new starts (roughly 150,000/yr.). Recent price pressures are strongly influenced by the number of listings, which since late 2015 were declining, and helping to drive large price gains. This was exacerbated by regional and international migration flows that especially centred on Vancouver and Toronto relative.
- The key role of the FTB in purchasing the generally more modest homes vacated by move-up buyers, and thus fuelling the increase in demand required to support the market for new ownership housing, is fairly well understood.
- Less well understood is the concomitant role of the FTB in creating a “supply” of vacancies in the existing rental housing stock by leaving the rental sector as they move into homeownership. As discussed, any slowdown in the natural process of young households leaving rental housing to buy their first home will have a dramatic negative effect on the rental market. At roughly 250,000 units a year, this “supply” of rental housing from departing FTBs dwarfs the additions to the rental stock provided through new rental construction and provides the vacant rental units necessary to accommodate newly-forming households.
- Small-scale investors purchasing condominiums and homes as landlords are a significant source of rental “supply” although this may not be permanent rental stock (units may subsequently revert to owner occupied use).
- Transactions of rental investment properties involve substantially more units than the volume of purpose-built new rental starts, and often result in a loss of units (via property redevelopment) or an upward shift in rents (reducing affordability).
- In the low-modest rent part of the rental market, there is an ongoing erosion of units (absolute loss and rent inflation) such that these “losses” negate new affordable housing production by a large margin. Between 2011-16 the number of units renting below %750/month declined by almost 400,000, far exceeding the fewer than 50,000 new affordable units created under IAH.
- Traditional supply options to create affordable housing have modest budgets and, because of the costs associated with developing new housing, they create relatively few units. Encouraging and enabling non-market providers to purchase existing rental properties could expand the non-market sector, and assist in preserving existing relatively affordable housing.
- The existing stock of non-market housing is small and shrinking. At its peak, including provincial unilateral units this stock reached around 700,000 units. But with the ongoing process of expiring long-term federal operating agreements and subsidies, this resource is at risk. Without some ongoing subsidy many providers are unable to sustain low affordable rents and lack the financial capacity to maintain the homes in sound condition.
Constrained access to ownership
The dramatic jump in the ownership rate (1996-06) has stalled. For the first time in 50 years, the ownership rate declined between 2011-16 (back down to 67.8%). In part, this relates to the fact that the pent-up demand for ownership, which was built up in the early 1990’s, was largely satisfied by 2011.
But it also reflects constraints on access to ownership for FTBs due to a combination of persisting price increases (and the related burden of accumulating a down payment), as well as macro-prudential policy initiatives that have sought to manage the burgeoning growth in household mortgage debt (without any parallel accounting of the underlying value of the assets associated with that debt). There are two related critical policy concerns:
- Access to homeownership for millennial and other FTBs is becoming increasingly difficult –particularly in high-cost markets such as Toronto and Vancouver. To the extent that home assets are associated with wealth, inability to access ownership may contribute to less lifetime wealth, a reduced nest egg for retirement, and growing inequality (between renters and owners).
- Secondly, as discussed, as young households (and recent immigrants) remain in the rental market (rather than purchase a home), this will increase demand in that part of the system. Due to the stalling of the normal upward movement of young households into ownership, vacancies will not be created for newly forming households and immigrants. This will place pressure on rents and the availability of moderately priced rental options.
The ability to access ownership is a critical feature of the housing system that moderates pressure on the rental sector. This was especially notable between 1996 and 2006 – but this release valve is now under threat. In the highest price cities, these pressures are now evident in the rental sector – rents in Vancouver and Toronto increased by more the 5% annually in the last two years.
This suggests that efforts to manage broader economic concerns, such as high levels of household debt, be developed and implemented with caution, and re-evaluated as impacts on the housing market become evident.
Encouraging both traditional and non-traditional rental supply
There has been a relatively low level of purpose-built rental construction (compared to the overall proportion of renter households). While, in the earlier decade (mainly 1996-2006) this has been offset in part by the shift of households into owning and by the creation of rental opportunities via investor purchased condominiums, it is clear that neither of these phenomena will have the same impact going forward.
Increased house prices together with new lending regulations will act to constrain the ability of some small-scale investors to “create” rental opportunities by purchasing and renting out condominiums, just as pressure for rental housing is rising as a result of an increased inability of potential FTBs to access homeownership.
Encouraging both traditional (purpose-built) and non-traditional forms of rental supply will be important in mitigating the increased pressure in the rental market resulting from a reduction in the number of FTBs able to access homeownership in the coming years.
Erosion of lower rent stock
Demolitions related to redevelopment and intensification are removing some modest rent units from the stock. At the same time, other older buildings have shifted out of the relatively affordable levels due to investments in renovations (with commensurately higher rents). Over the past decade (2006-16) the number of units renting for less than $500/month (affordable to incomes of $20,000) declined by 430,000. The erosion of lower rent options is especially problematic for lower income renters. It also presents a serious challenge to “housing first” approaches that seek to alleviate homelessness, as it erodes the low rent more affordable stock available to facilitate housing of homeless persons seeking to stabilize.
Creating policy to support a healthy rental sector
While there is concern that current policies may constrain access to ownership, this does not mean that housing policy should focus only on enabling this aspiration. In the context of constrained access it has become critically important to establish a policy framework that grows and strengthens the rented sector to provide a full range of housing opportunities.
In the new information and technology-based economy, a well-educated and mobile labour force is increasingly important to productivity and economic outcomes. Renting provides a more flexible tenure for labour force mobility and may provide advantages to some people in the labour market going forward. It requires a coherent policy framework to facilitate this evolution.
Role of non-profit/non-market sector
The social-non-market housing stock is a small but important part of Canada’s housing system. It provides a valuable resource to low and moderate-income households as well as those with special needs such as the homeless and Indigenous people. Public and non-profit ownership of housing in the non-market sector helps to preserve affordable rent options for those who need it.
The non-profit sector seeks to grow through new construction but this is increasingly challenging due to the high costs to develop new housing and the minimal leverage to finance these projects generated by low affordable rents. It is very difficult to develop new housing at affordable rents: homes built at cost must be subsidized to make them affordable. This can be achieved either through on-going rental subsidies that cover the gap between break-even and affordable rent (as with pre-1994 social housing programs), or the current method of providing capital grants to reduce or eliminate ongoing debt expenses.
Lessons from the past and legacy social housing portfolios reveal additional challenges to sustainability. Developing non-market properties and setting rents at low “affordable” levels robs the project of much of the rent revenue required to operate on a viable basis, and to provide ongoing reinvestment to maintain the asset in sound physical condition.
An option that could be considered is to separate supply programs from affordability – i.e. new projects would be developed at market (or near-market) rents. Affordability for some percentage of the units can then be separately managed by providing housing allowances to lower income tenants. Such an approach is proposed under the new NHS, but details remain to be designed and negotiated with PTs. With this approach, the project operates on a breakeven or market basis (including providing the capacity to cover on-going operating costs and to undertake major capital replacement as needed) by leveraging stronger rental cash flows, while still providing low-rent units to those in need – through the housing allowance. To sustain existing social housing with expiring subsidy, these could be project based (linked to existing rgi units).
Another option to help to grow the non-market sector effectively is to encourage non-profits to purchase existing market properties that currently rent at moderate (e.g. average market) rents. These would require substantially lower capital costs than new development. With non-profit ownership, this would help to preserve this lower rent stock. As above, households that cannot afford the rents in these (lower-rent) buildings could be assisted through a housing allowance (the cost of which would be significantly less than would be required to cover the difference between affordable rent and breakeven rent for a new rental building).
There is potentially also a role for the non-profit sector to participate in building modest market rental, with rents in the range of 100-130% of the average market rent (AMR). Most new private rental developments target rents at the upper end (140% and above) so there is a void in the “intermediate rental market.” The recent federal Rental Construction Financing Initiative may create some incentives (requires units be priced 10% “below market potential”, which would fall around 130% AMR) to help fill this gap. This financing program enables developers to build with no equity (loans at 100% of cost). Non-profits could develop such projects as a way to add supply (without need for subsidy) and concurrently strengthen the viability of their organizations by reducing their reliance on low-rent social housing without reducing subsidized supply. The RCFI is subsumed within the NHS and will continue over the next 3 years.
Critical need to expand data collection and analysis
Across these issues there is a critically important common theme: there are insufficient and inadequate data available to fully monitor and appreciate the ongoing changes in Canada’s dynamic housing system.
While there are concerns and perceptions about constrained access for FTBs, Canada has no readily available or published data to validate and monitor this issue. There is no data to quantify what portion of purchasers are first time buyers, and how this is trending. Since this is emerging as a significant policy challenge, it is necessary that such data be collected.
To start, it would be very useful to derive reliable estimates of the numbers of FTBs over time. In terms of monitoring changes in the numbers of FTBs, to the extent that most require high ratio insured loans, this subset of insured borrowers could be used to develop a monitoring tool on the numbers and characteristics of FTBs and how these change in response to policy changes (data on insured loans is already suggesting a decline in the number of insured loans, which primarily go to FTBs). 19
In the private rental area, the ongoing erosion of low and moderate rent existing rental units can only be inferred from existing data sources. It is important to develop key measures to monitor changes in the stock over time – in particular, losses in the critical lower rent stock. Data from the 2016 census have revealed a substantial loss, but more frequent monitoring is required during the inter-censal years.
Individuals purchasing condominium units have become an increasingly important source of rental supply. Currently, the CMHC rental survey provides estimates of such volumes, but this does not necessarily pick up changes due to sales of investment properties or changes when an owner investor moves in or out of a unit, used at some point as a rental property. New rules on tax filing to identify sale of a non-principal residence may provide some insight into such investors, provided such data fields are made available to Statistics Canada.
Recently alternate uses such as listing units on Airbnb have also removed some of these investor units from the rental supply, and similarly little is known about the scale of this phenomenon.
Tracking the volume of new investor purchasers would also help to monitor any unintended impacts of tighter lending rules on investor loans.
In the non-market-affordable part of the housing system, there are two important ongoing changes:
- Additions to the stock through developments under the IAH program, and
- Impacts on the stock through the expiry of subsidies on existing social housing.
Estimates of the numbers of units in the stock are based on historic data and inference using some provincial data, but there is no single comprehensive source of data to monitor the stock. And there is no enumeration of the scale of new additions under IAH rental initiatives. And while the number of units no longer “under administration” can be inferred from CMHC annual statistics, there are no details on the impacts of these expiring federal operating subsidies.
Prior to 2002 CMHC captured social housing starts as part of its starts and completions survey. This practice was terminated in 2002. In part this was because defining the product became difficult, as the concept of 100% directly public funded social housing no longer existed. It was difficult to distinguish since new developments had no ongoing subsidy and were no longer considered as “social housing.” Also, some housing was being developed under unilateral provincial programs (versus earlier NHA programs) and the funding was also available to private developers making it difficult to distinguish social housing from market rental.
Reporting under the current FPT bilateral funding agreements includes some data but it is woefully inadequate. In particular, it does not clearly distinguish between new affordable rental versus other initiatives such as housing allowances or assisted ownership. Nor does it report of the degree to which units achieve affordability (e.g. RGI rents versus at or below 100% of the average market rent).
It would be valuable to reinitiate the enumeration under the starts and completions survey, using IAH (or unilateral PT) funding and/or rents set at submarket levels as a flag to determine if a unit would be counted. This would make it possible to better measure the impacts of IAH and other publicly funded programs (and support the implementation of the national housing strategy).
It is noted that Budget 2017 and the NHS has signaled a commitment to evidence-based policy and decision-making and has made substantial financial commitments to this end. This includes $241 million over 11 years to enable CMHC to improve data collection and analytics, expand housing research with partners, and demonstrate and test new design solutions to affordable housing challenges. It also provided $39.9 million to Statistics Canada to develop and implement a new Housing Statistics Framework.
With this level of financial resourcing it is expected that a substantial progress can be made in strengthening data collection systems and coverage to enable appropriate monitoring and management of the housing system.
Conclusion
The overarching objective of a national housing strategy (NHS) is (or should be) to sustain a healthy well-balanced housing system: a system that offers choice across tenures as well as a sufficient supply to maintain choice and relative affordability.
The analysis in this paper has clearly revealed that anything done in one segment of the system (e.g. tightening insured mortgage lending rules) creates consequences in other parts of the market, in particular rental affordability.
In addition to developing and implementing new initiatives to respond to an array of housing challenges, a critical element of the NHS should be to collect data to help fully understand the wider impacts of specific policy changes and to pro-actively monitor how well the system is functioning, This should include establishing a process to identify gaps and any dysfunctionality and to implement remedial actions.
The NHS should also monitor the impacts and effects of government policy and actions on the health of the housing system. The recent trends and concerns about rising prices, impacts on the broader economy and levels of household debt, as well as the subsequent actions of the Department of Finance and the Office of the Superintendent of Financial Institutions (OSFI) to address these risks, serve to underline this requirement.
Endnotes
1 This is derived by estimating the total number of owners if the rate had remained at 64% and subtracting from actual number of owners in 2006.
2 W. Mark Brown and Amélie Lafrance (2013) Trends in Homeownership by Age and Household Income: Factors Associated with the Decision to Own, 1981 to 2006. Statistics Canada, Economic Analysis Division
3 To compare at the same point in time, the April 2011 CMHC survey universe of 1,839,101 (centres 10,000 plus) plus 740,000 social housing units (total 2,439,000) can be compared to the count in the 2011 NHS conducted in May of that year (4,016,385). The NHS number reflects occupied dwellings, versus actual dwellings, so the total number of rental units will be higher due to vacant and unoccupied dwelling units. So the purpose-built universe is roughly 60% of all rentals. Universe data is not available for 2016, as CMHC no longer publish a detailed report including row units at the Canada level.
4 CMHC Canadian Housing Statistics 1994 enumerate a total of 662,000 units “under administration” of federal and federal-provincial joint programs. These include units listed in 1994 as rent supplements, which are stacked on either existing non-profit or on private rentals. It also excludes subsidies related to renovation of rental properties. Netting these out leaves the net total of 599,300.
5 Estimates by Greg Suttor 2016, Still Renovating. Note there are not comprehensive or complete data sources to describe the non-market stock, and CMHC no longer enumerates starts funded under assisted programs, so estimates are based on various sources and inference.
6 Some may be totally lost through demolition; others will be removed from the non-market sector or have rents increase to quasi-market levels and thus no longer be as affordable.
7 The rent ranges used in each census/NHS period changed, so data are pro-rated to estimate the number of units in similar nominal rent ranges in each census.
8 Estimated based on the reported rents in CMHC rent survey comparing units constructed after 2005 against overall average.
9 Rental Ownership Structures in Canada, Housing Market Insight, July 2017, based on a survey of owners as part of fall 2016 annual rental market survey.
10 The recently release National Housing Strategy has established a target to reduce renter core need by 530,000 over 10 years, proposed programs aimed both at adding new affordable supply but also a new initiative to create a housing allowance (Canada Housing benefit) to specifically target affordability issues. As proposed it is unlikely this will remove households fully from need, but will reduce severity of need.
11 Encouraging and facilitating transition off of assistance may be more challenging under supply programs when allocated a specific dwelling unit as the household may become attached to the home and the community (with improved income any income based rent would increase, but the dwelling would not be available to help another family in need).
12 Migration data at the CMA scale is available only through 2014. Here, provincial level data is used to capture the more recent trends. From 2011 to 2014, Toronto captured 74% and Vancouver 64% of international migrants of their respective provincial totals.
13 Budget 2016 allocated $30million to help address any viability and RGI issues associated with expiring agreements on federal projects.
14 The details of the rental Construction Financing Initiative were released in April 2017, with a primary focus on stimulating market rate rental housing, with a modest requirement for some affordable units – see Pomeroy and Lampert (2017) New CMHC Rental Construction Financing Initiative: A New Opportunity for CHBA Developers.
15 An assessment of the 2017 Federal budget is available here https://carleton.ca/cure/wp-content/uploads/CUREBrief-Federal-Budget-2017.pdf
16 As reported in Financial Post July 6th. http://business.financialpost.com/personal-finance/mortgages-realestate/osfi-tightens-rules-on-uninsured-mortgages
17 Move-up buyers may however have a new demand effect if selling in one market and relocating to an undersupplied one.
18 This is roughly corroborated by estimates of total FTBs in sales data. MPC estimated that, in 2015, 45% of sales were to FTBs and this would generate an estimate 280,000 in that year.
19 For example see Globe and Mail August 1, 2017, “Genworth Hit Hard” https://www.theglobeandmail.com/report-on-business/genworth-hit-hard-by-new-mortgage-insurancerules/
article35860703/